

Epidemiologist. Security engineer. Former Q-cleared scientist, Sandia National Laboratories. Ph.D., Emerging Infectious Disease and Epidemiology. Former DHS Center of Excellence Research Fellow. Former U.S. Army infantryman.
BOTTOM LINE UP FRONT
This is the installment where I can be proven wrong, and I have built it so that you can do the proving. Parts I and II asserted that the American biological sensing enterprise produces fragments and never assembles them into a picture. An assertion about architecture is cheap. So here I take one real event, the emergence of H5N1 genotype B3.13 in United States dairy cattle, and reconstruct it as an information pathway: what was observable, what was observed, who held it, when it moved, and where it stalled. If the picture assembled itself cleanly and on time, the timeline will show that, and my thesis fails.
It does not show that. Seven judgments, each with my confidence on a 0 to 100 scale. Judgments 1 through 3 rest on published, peer-reviewed evidence and federal records, and are scored accordingly. Judgments 4 through 7 are analytical.
1. The virus entered dairy cattle around late October 2023, months before anyone knew. This is not my estimate; it is the published phylodynamic finding, with a formal uncertainty interval, and it has been independently reproduced. High confidence, 90.
2. Confirmation came on 25 March 2024. The interval between biological onset and institutional knowledge was therefore roughly five months, during which the event was real, spreading, and invisible. High confidence, 88.
3. The signal that finally broke through was not a surveillance system. It was a milk production loss noticed by producers and worked up by a veterinary diagnostic laboratory. The human sensing enterprise described in Part I contributed nothing to detection. High confidence, 85.
4. The delay was not a laboratory failure or a scientific failure. Every institution on the pathway performed roughly as designed. The failure was that nothing was assembling the fragments, which is the failure Part II predicted the architecture would produce. Assessed, 85.
5. Two clocks matter, and public health measures neither of them systematically. Time to Knowledge, the interval from biological onset to a decision-maker’s accurate understanding, and Time to Action, from onset to the first intervention that changes transmission. For B3.13 both are measured in months, and the second is longer than the first. Assessed, 85.
6. Time to Knowledge is not one number but a chain, and its total is dominated by a single term: the interval before anyone was looking at all. Compressing testing, sequencing, and reporting, which is where nearly all modernization money goes, cannot compress the term that dominates. High confidence as an analytical judgment, 85.
7. This clock is not American. The same interval, cryptic circulation ending in an alert observer rather than a system, recurs across countries and across pathogens, including the one that shut the world. High confidence, 85.
I want to state plainly what this piece is not. It is not an accusation against USDA, CDC, state veterinarians, or the producers, all of whom moved quickly once the question was asked. It is an argument that the question was asked five months late, and that no one’s job description included asking it earlier. To readers outside the United States: run this same clock against your own last event before you conclude this is an American problem. I will show you at the end why I believe your answer will look like mine.
SECTION I · THE TWO CLOCKS
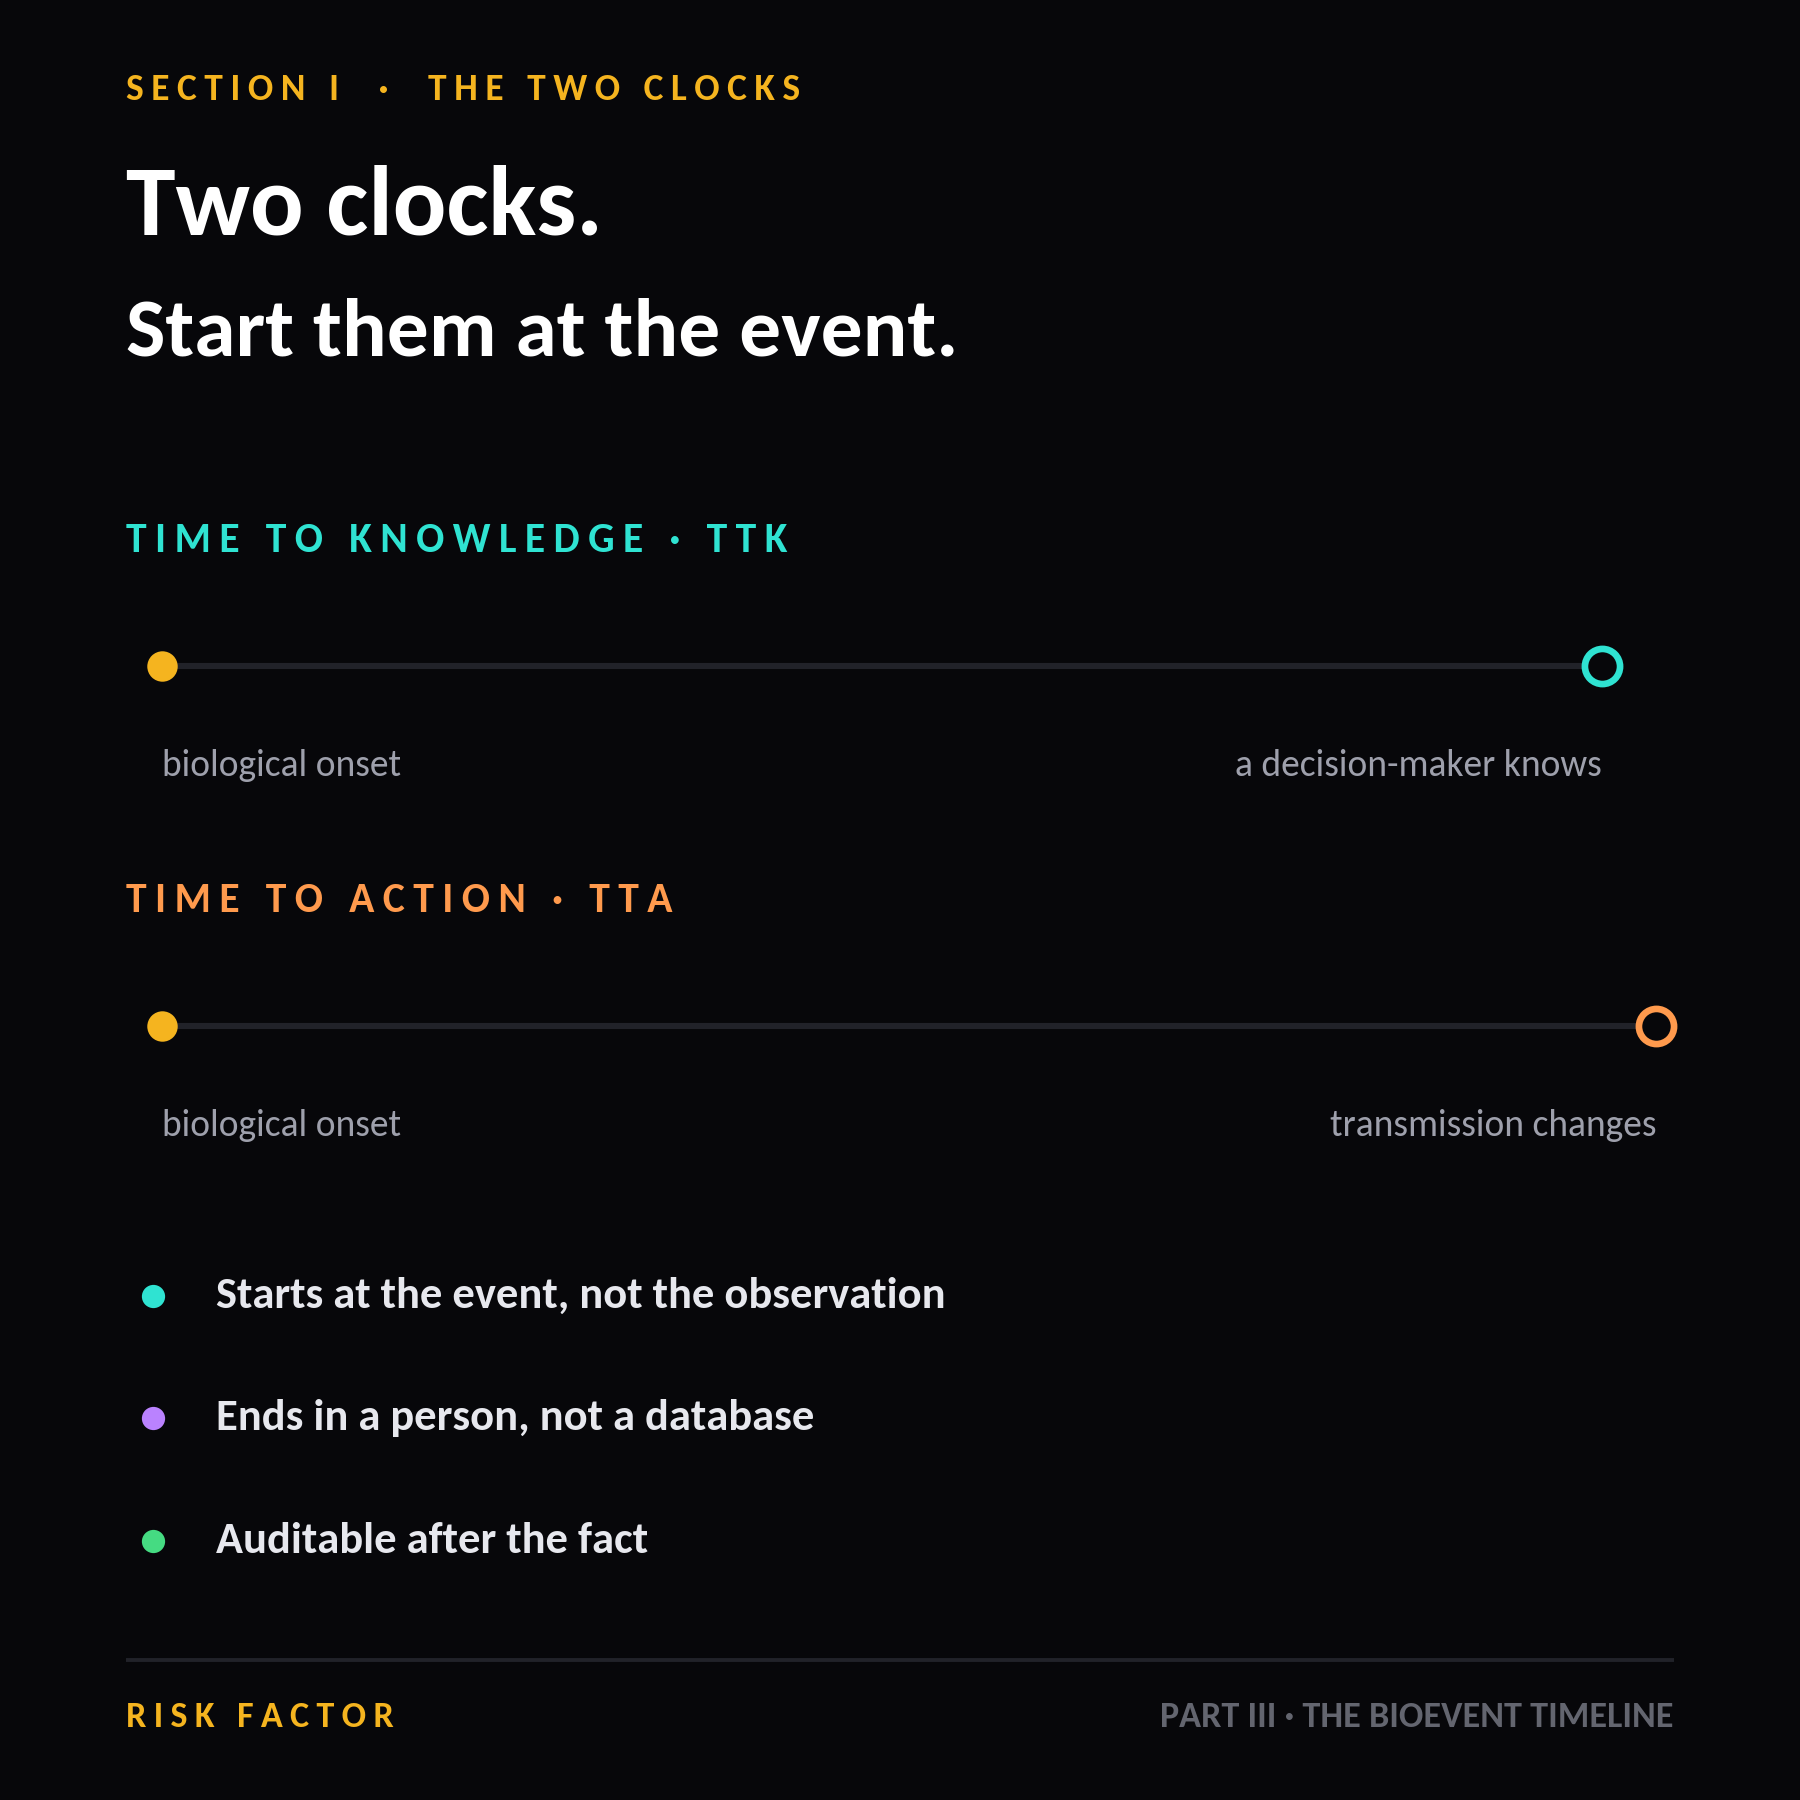
Figure 1. The two clocks. Time to Knowledge runs from biological onset to a decision-maker’s accurate understanding; Time to Action runs from onset to the first intervention that changes transmission. Schematic; the B3.13 values plotted in Figure 3 are sourced.
The Two Clocks
Before the case, the instrument. Public health measures many intervals well: turnaround time, reporting completeness, days from specimen to result. Every one of those measures a segment of the pathway. None measures the whole, and the whole is what a decision-maker experiences.
So let me define two quantities plainly, and use them for the rest of this series.
Time to Knowledge (TTK) is the interval from the biological onset of an event to the moment a decision-maker holds an accurate, actionable understanding of what is happening. Not the first positive test. Not the first case report. The moment someone who can act knows what they are looking at.
Time to Action (TTA) is the interval from that same biological onset to the first intervention that measurably changes the trajectory of transmission.
Three properties of these measures are worth stating before we use them.
They start at the event, not at the observation. This is the whole point. Any clock that starts when the system first notices is a clock that cannot see its own largest error, and most published surveillance metrics start there. TTK starts where the biology started, which is knowable retrospectively through genomics, and which is exactly why the case in this piece is the right one.
They terminate in a person, not a database. Knowledge means an accurate understanding held by someone with authority to act, which is Part I’s seventh term. A confirmed result sitting in a laboratory information system, correctly, is not knowledge in this sense. This is a demanding definition, and it should be.
And TTA can exceed TTK by a lot, because knowing and acting are separated by consent, jurisdiction, and negotiation, all of which Part II mapped. When TTA runs far behind TTK, you are looking at an authority problem, not an information problem, and the distinction dictates the fix.
Both clocks are reconstructable after the fact, which makes them auditable. That is the property I care about. An institution can dispute my analysis of its architecture. It is much harder to dispute a date.
SECTION II · THE RECONSTRUCTION
The Reconstruction
Now the case. I am going to walk it as an information pathway, marking each fact as known, assessed, or unknown, exactly as the rest of this series does.
Late October 2023. The event begins, unobserved. Published phylodynamic analysis of the B3.13 genotype places the spillover from wild birds into dairy cattle at approximately late October 2023, with a 95 percent interval running from 30 September to 22 November 2023, and a subsequent independent analysis reaches consistent estimates. The whole-genome evidence supports a single introduction, and it was followed, in the authors’ own characterization, by months of cryptic transmission before detection. Known, from the genomic record. Note what this fact is: a measurement of exactly the interval no surveillance system recorded, recovered later from the virus itself. The virus keeps the log the institutions did not.
January and February 2024. Fragments accumulate in private hands. Producers in the Texas panhandle observe cattle going off feed, dropping milk production, and producing thickened, discolored milk. Some consult private veterinarians. Field reporting and later investigation also describe unusual deaths of barn cats and wild birds on affected premises, a signal that in hindsight is diagnostic and at the time was an oddity on someone’s property. Known in outline from subsequent reporting and the published investigation; the precise dates of individual observations are unknown, because no system was designed to timestamp them.
Hold that last sentence, because it is the finding underneath the finding. The reason this timeline has a fuzzy middle is not that I could not find the records. It is that the records were never created. There is no instrument in the American architecture whose job is to receive “something strange is happening in my herd” and place it beside “something strange is happening in my emergency department.”
Early to mid March 2024. The pathway finally engages. A multistate investigation into unexplained milk production losses is underway, involving producers, private veterinarians, state animal health officials, and veterinary diagnostic laboratories. Samples move to laboratories in the National Animal Health Laboratory Network, the 66-laboratory system Part II described, and to university diagnosticians. Known.
Notice which network is carrying the signal. Not the 3,000 local health departments. Not the 320,000 CLIA testing sites. Not the electronic case reporting stream, the syndromic system, or the commercial laboratory feed, all of which were operating normally and all of which were blind to this event by construction, because the patients were cattle.
25 March 2024. Confirmation. USDA’s National Veterinary Services Laboratories confirm H5N1 clade 2.3.4.4b, genotype B3.13, in a dairy cow in Texas. Known, from the federal record. TTK, measured from the central spillover estimate to this date, is approximately five months.
1 April 2024. The human seam. Texas reports the first human case associated with the outbreak, a dairy worker with conjunctivitis, confirmed by CDC. Known. Read the sequence carefully: the human health enterprise learned of this event from the animal health enterprise, one week after the animal enterprise learned of it, and roughly five months after it began.
24 to 29 April 2024. The first structural intervention. USDA APHIS issues a Federal Order requiring negative influenza A testing for lactating dairy cattle prior to interstate movement, and mandatory reporting of positive results by laboratories and state veterinarians. It takes effect 29 April. Known. TTA, measured from the same spillover estimate to the first measure that could plausibly alter transmission, is approximately six months.
December 2024. The surveillance instrument that should have existed arrives. A second Federal Order establishes the National Milk Testing Strategy, requiring bulk raw milk sampling from silos nationwide, with testing beginning the week of 16 December 2024. Known. This is the right instrument, and I will credit it as such in Section IV. It arrived roughly fourteen months after the spillover it would have detected.
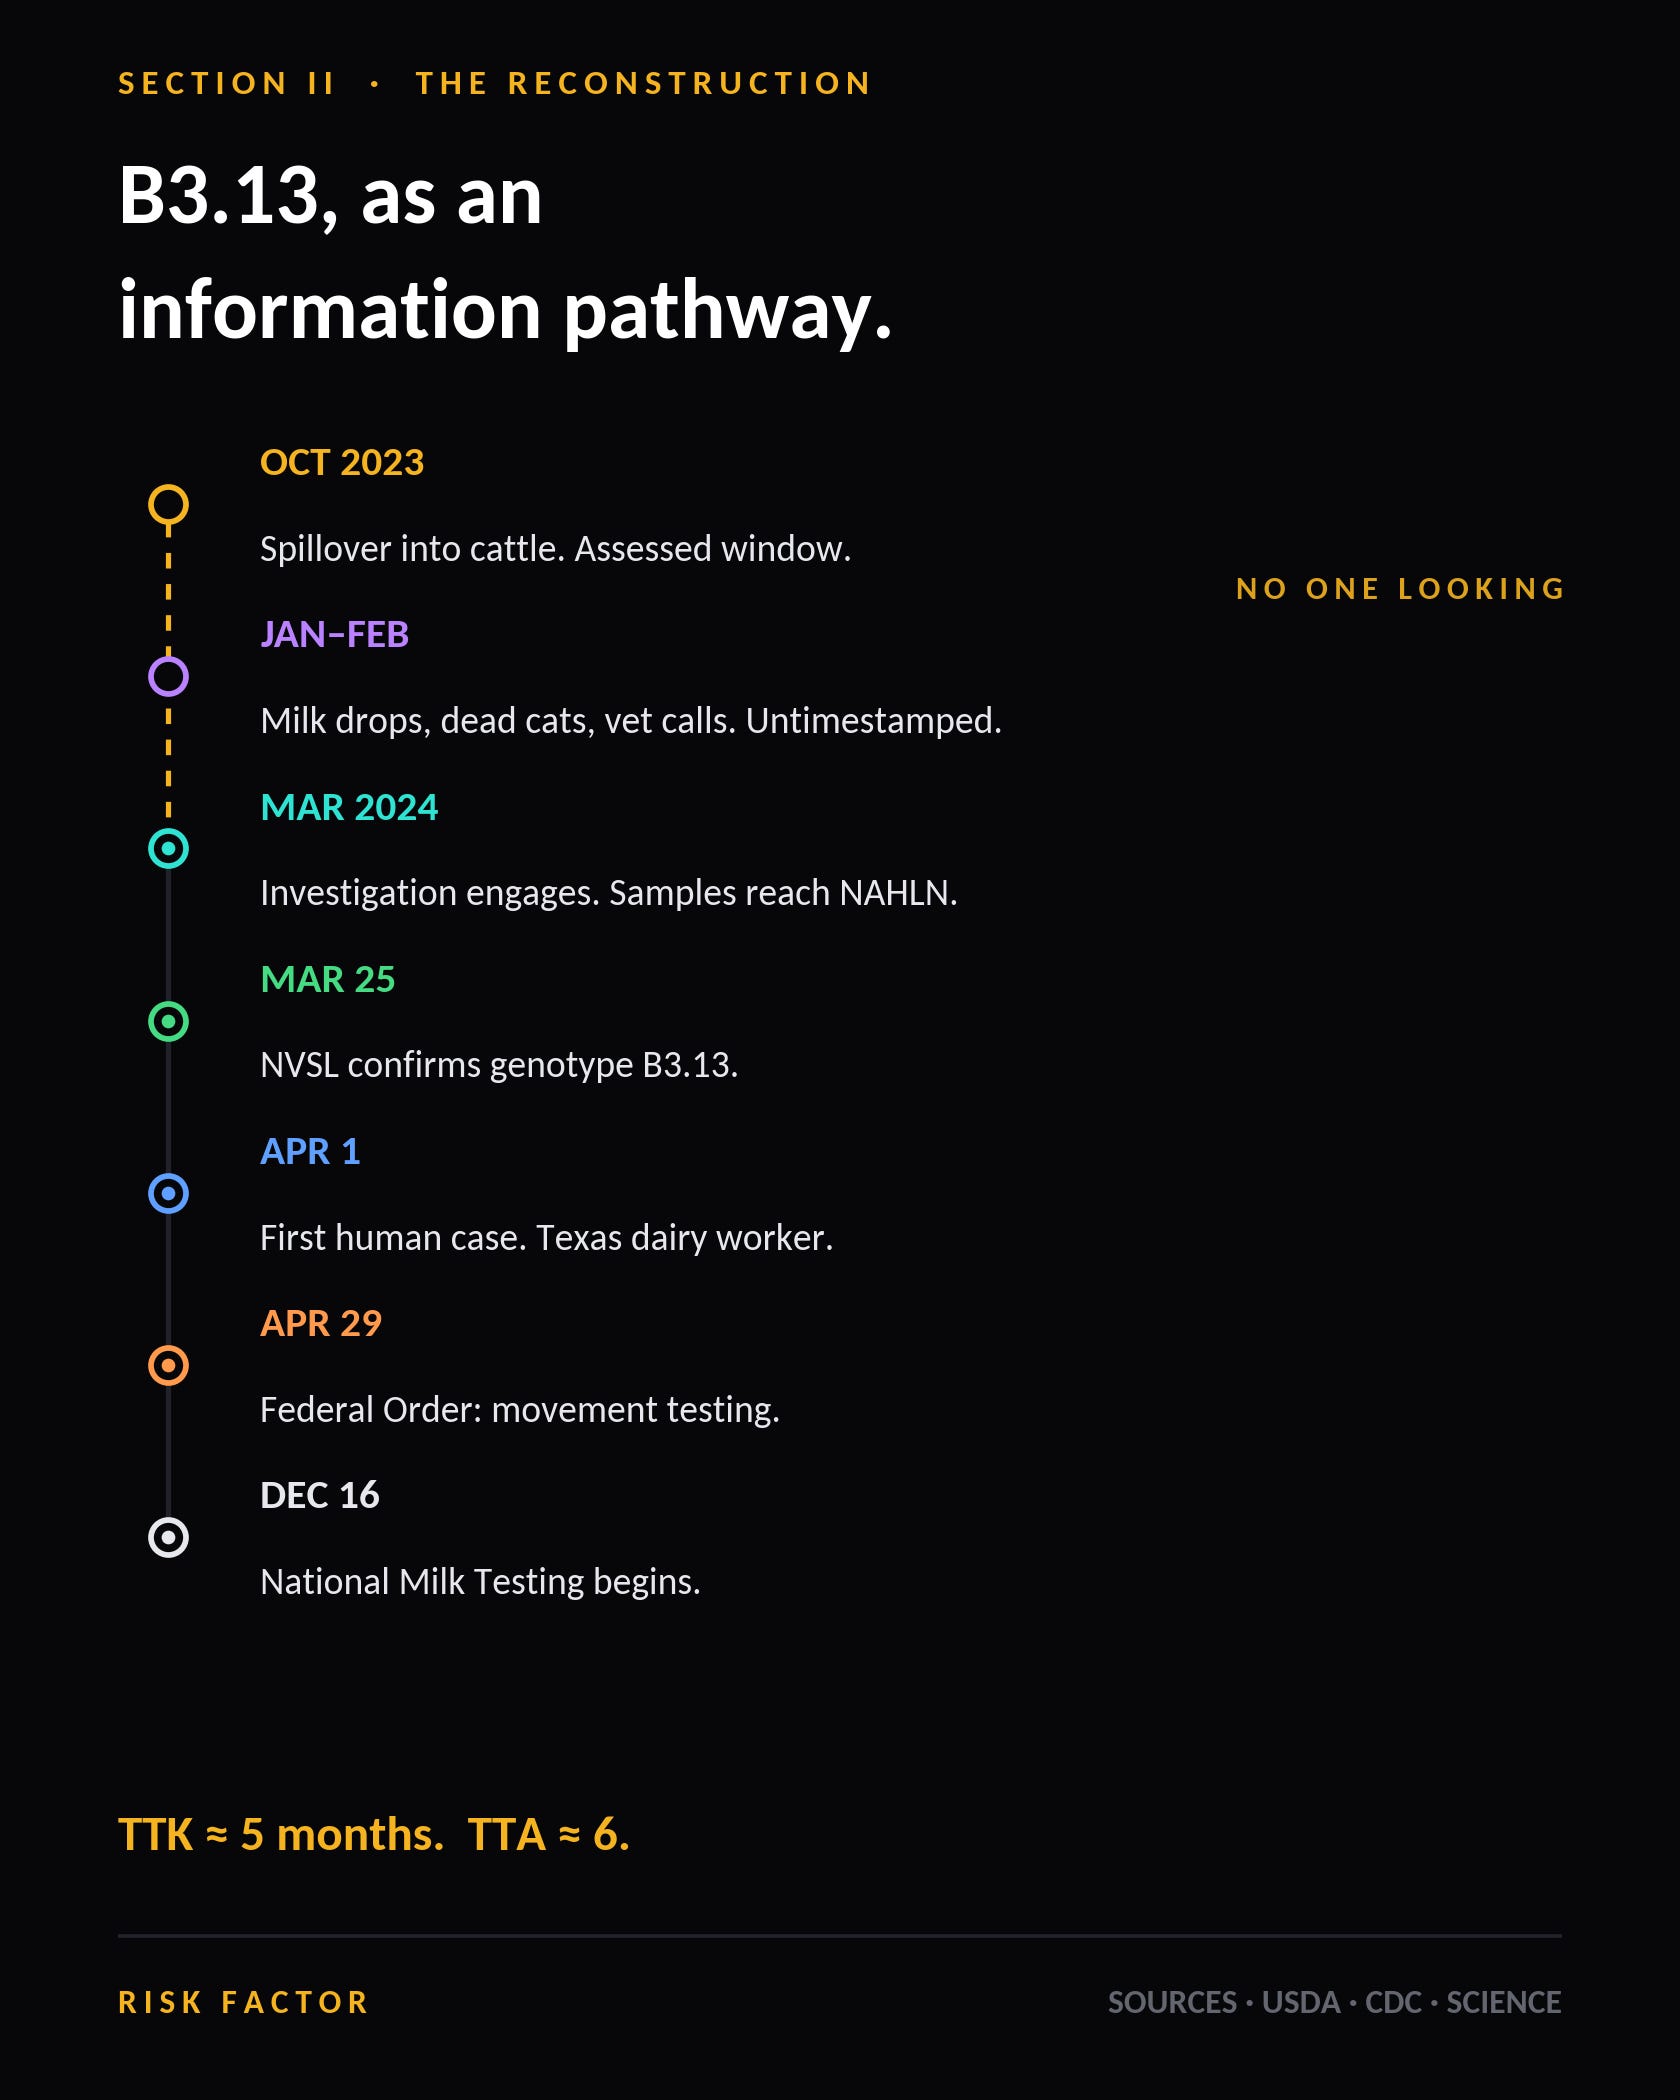
Figure 2. The pathway. B3.13 from spillover to first structural intervention, with each handoff marked by custodian. Dates and institutions are sourced; the fragment observations in the shaded interval are documented in outline but were never timestamped by any system, which is itself the finding.
SECTION III · READING THE CLOCK
Reading the Clock
Now decompose the interval, because the shape of the delay matters more than its length.
Roughly five months from onset to confirmation. Of that, the segment that surveillance modernization actually addresses, specimen to laboratory to confirmed result to notification, took days. Not months. Days. The laboratories performed. The network performed. The confirmation was fast, and the response after confirmation was, by the standards of federal action, quick: one week to the first human detection, one month to a national movement order.
Nearly the entire interval sits in one term: the time before anyone was looking. Call it the latency of attention. It is not testing latency, reporting latency, or analytic latency. It is the interval during which the event was generating observable fragments in the world and no instrument existed whose job was to notice that they belonged together.
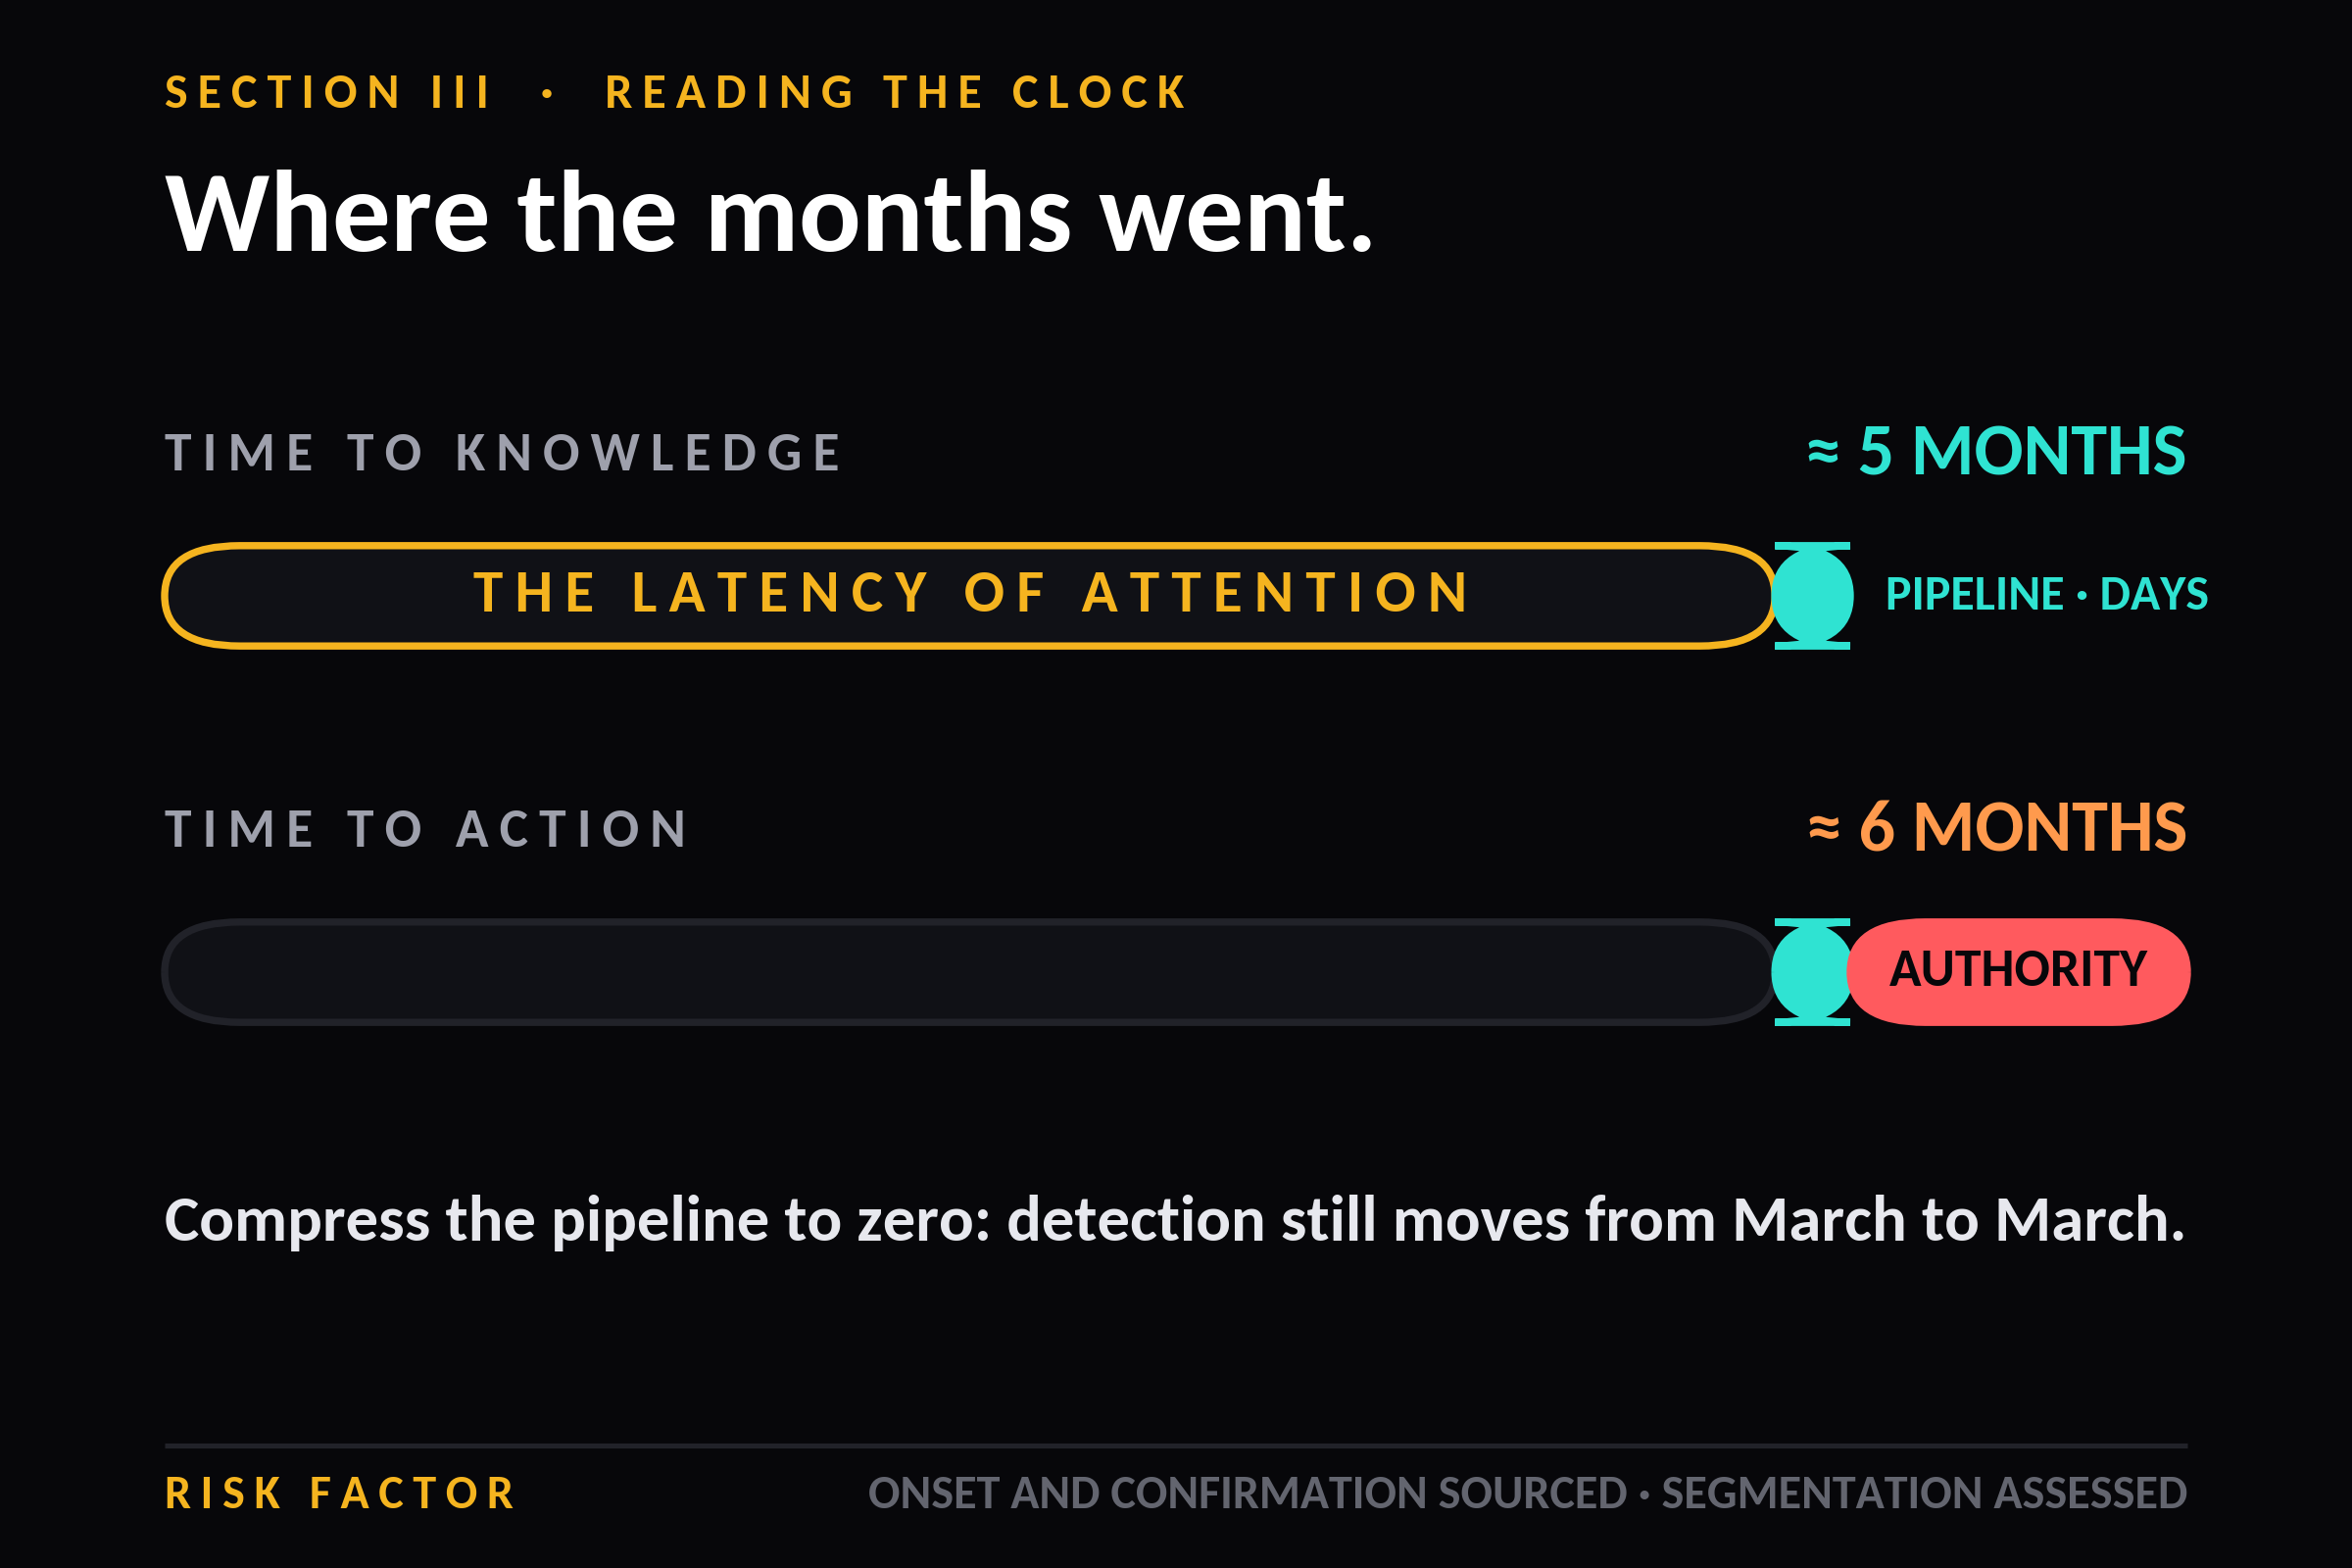
Figure 3. Where the five months went. Nearly the entire interval from onset to confirmation is the period before anyone was looking; the laboratory and reporting segments that modernization funds are measured in days. Onset estimate and confirmation date are sourced; the internal segmentation is assessed.
This is Part I’s argument arriving as arithmetic. The seven-term function said modernization funds coverage and latency while the breakage lives in integration, inference, and authority. Here is what that costs on a clock. Compressing the laboratory and reporting segments to zero, a physically impossible standard, would have moved detection from March to March. The dominant term is untouched by any amount of pipeline speed, because it is not a pipeline term. It is the absence of an assembler.
And notice the second arithmetic fact. TTA exceeded TTK by roughly a month, and the gap is pure Part II: the intervention required a Federal Order, because the authority to compel testing across sovereign state lines and private operations existed nowhere else. The information problem cost five months. The authority problem cost one more. Both are architecture.
One further observation, and it is the most uncomfortable one in this piece. The signal that broke through did so because milk is a commodity that is measured continuously for economic reasons. Production dropped, and the drop was visible because someone was counting for money. Had this pathogen infected a species whose output nobody meters daily, the interval would have been longer. We were, in a real sense, saved by accounting.
SECTION IV · WHAT WORKED
What Worked
This series credits genuine performance by name and number, so here is the honest ledger, and it matters for the finale.
Once the question was asked, the answer came fast. Confirmation to first human detection, one week. Confirmation to a national movement restriction, one month. Genomic characterization of a novel genotype in a novel host, essentially immediate, with published phylodynamics within months. Those are not the numbers of a broken scientific enterprise. They are the numbers of a good one, started late.
The National Animal Health Laboratory Network performed the function it was built for in 2002, and it is worth noting that this network exists at all because homeland security money built it after 2001. When the fragments finally reached an instrument designed to receive them, the instrument worked.
The National Milk Testing Strategy is the correct instrument, and it deserves specific credit: bulk silo testing is exactly the kind of population-level, low-burden, continuous sensing that would have compressed the dominant term. It is a genuinely good idea, implemented under authority, with a defined staging system. Its arrival fourteen months after the spillover is the finding, not its quality. The instrument was not absent because anyone was foolish. It was absent because building it required a Federal Order that required a confirmed emergency that required the detection the instrument would have provided. That circularity is the machine of Part II running on a clock.
Score it in the seven terms and the pattern is exact. Validity: excellent. Latency, in the pipeline sense: excellent. Coverage of cattle: absent before the event, then built. Integration across the animal and human seam: poor, which is Part IV’s subject. Inference: excellent, but retrospective. Authority: available, but only after emergency, and only through a federal instrument that had to be invoked rather than a standing capability.
SECTION V · THE SAME CLOCK ELSEWHERE
The Same Clock Elsewhere
If you work outside the United States, everything above may read as a story about American agricultural exceptionalism: enormous herds, interstate commerce, a fragmented federal system. Run the clock elsewhere and the shape recurs.
Run it on the event that shut the world. Retrospective work on the earliest COVID-19 cases places onset in Wuhan in December 2019, with the first clinical cluster recognized late in the month; the alert that reached the world came from a hospital physician and a market-linked cluster, not from a surveillance system finding an anomaly, and the Independent Panel concluded the international alert system was too slow for a fast-moving respiratory pathogen. Different country, different pathogen, different political system. Same shape: cryptic interval, alert human, system arriving afterward.
Run it on the arrival of H5N1 clade 2.3.4.4b in Europe and the Americas across 2021 and 2022, where the wild bird panzootic was reconstructed largely after the fact from sequencing, or on the 2011 Schmallenberg virus emergence in northern Europe, identified by metagenomic sequencing only after farmers reported unexplained losses in the field. In every case the reconstruction is possible, and in every case the reconstruction is what tells you how long you were blind.
Now the counterexample, offered honestly because this series does not stack the deck. Denmark, from Part II, would probably run a shorter clock on the human side of an equivalent event: with every microbiology result flowing automatically into one national database keyed to a lifelong identifier, the interval between a strange cluster existing and a national analyst being able to see it is genuinely compressed. That is the achievement, and I credited it and priced it in Part II. But mark the limit carefully, because it is the hinge of this series. Denmark’s integration would compress the analytic and reporting terms. It would do far less to the dominant term here, because that term was not about linking human records; it was about no one being assigned to notice that cattle, cats, and wild birds on the same premises constitute a single signal. Even the most integrated human health system on Earth is looking in the wrong place when the event starts in a barn. That is the seam Part IV is about, and it is why identity centralization is not the answer to this problem even for those willing to pay its price.
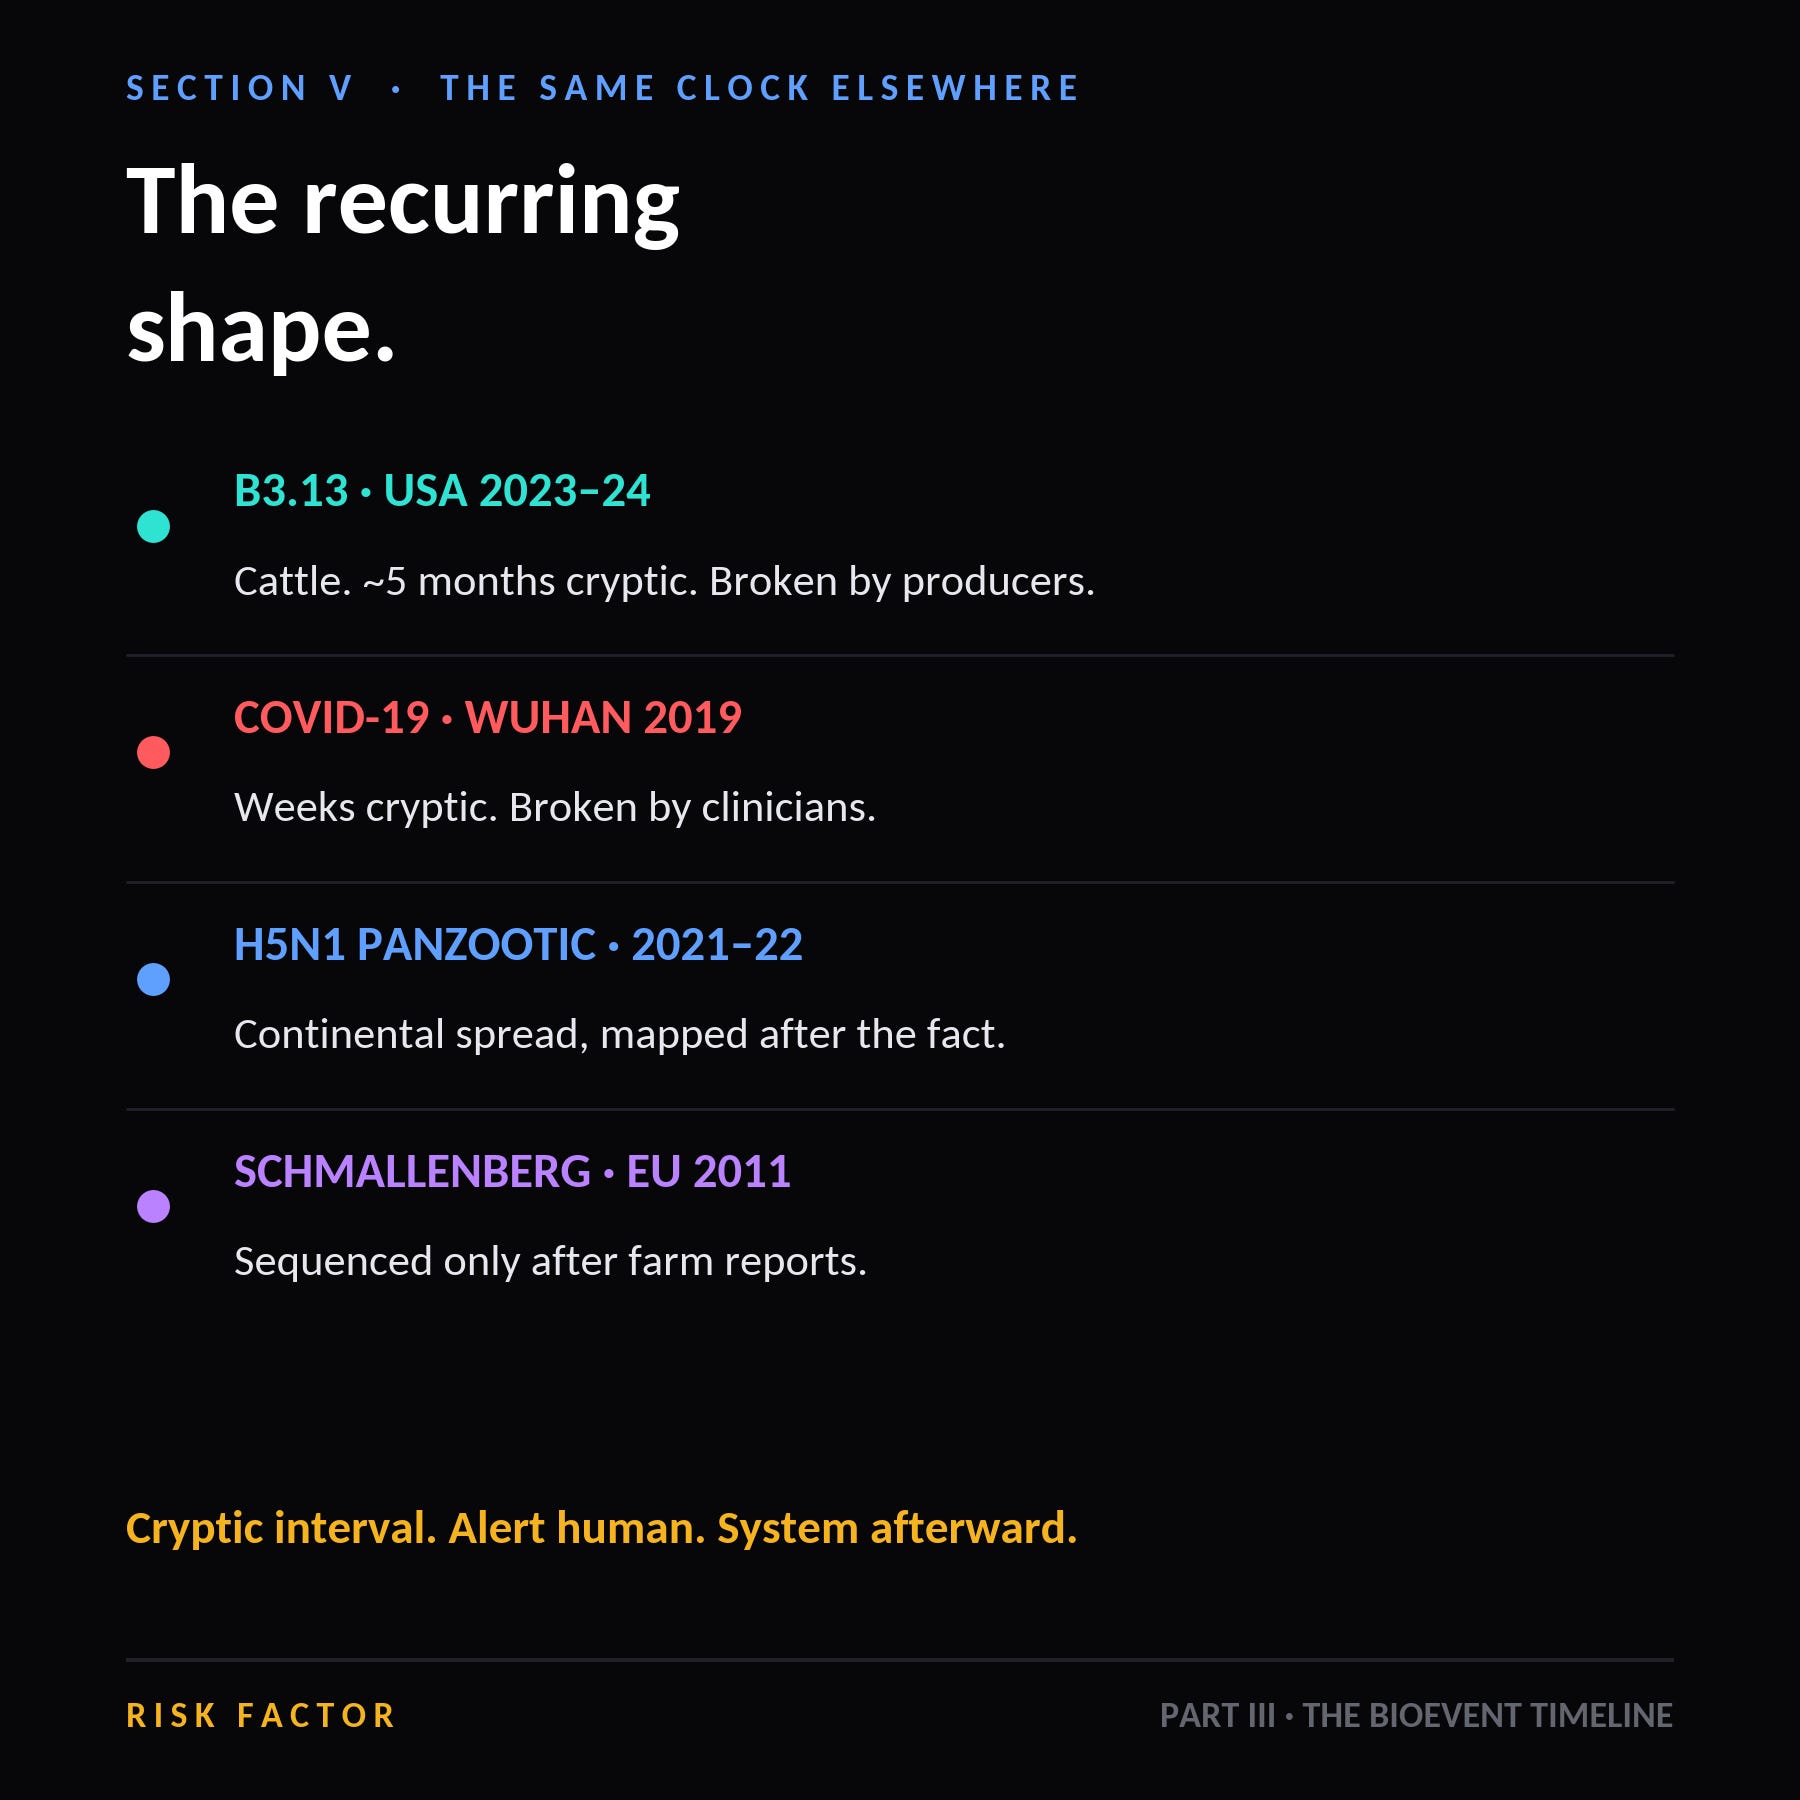
Figure 4. The recurring shape. Four emergences across three continents, each with a cryptic interval ending in an alert human rather than a system. Intervals are approximate and drawn from published reconstructions; the comparison is illustrative, not a controlled analysis.
SECTION VI · WHY THIS IS THE FALSIFIABLE PART
Why This Is the Falsifiable Part
Let me be explicit about what this piece was designed to risk.
The thesis of this series predicts a specific, checkable pattern in any real event: a long interval dominated not by pipeline delay but by the absence of an assembler; a break in the case coming from an alert individual rather than a system; and a gap between knowing and acting explained by authority rather than information. B3.13 exhibits all three. That is one case, and one case is not a proof. It is a demonstration that the prediction is not empty, and an invitation.
Here is the invitation, and it is the reason this installment exists in this form. Run these two clocks on an event you worked. Pick your own case, in your own jurisdiction, in any country. Mark the onset from genomics where you have it. Mark the moment a decision-maker actually understood. Mark the first intervention that changed transmission. Then decompose the interval and see which term dominates.
If your dominant term is pipeline latency, my thesis is wrong for your system, and you should tell me, because modernization is then exactly the right investment and I will say so in print. If your dominant term is the latency of attention, you have reproduced this finding, and you should tell me that too. Either way, this series improves. The standing rules on what you may lawfully share, from Part I, still apply.
Two clocks. Any event. That is the test.
Next week the seam these clocks kept crossing gets its own installment, because in this case the picture failed at a specific boundary: the one between animals and people, where the fragments were held by two different governments answering to two different laws, and where the next pandemic is most likely to begin.
RED TEAM
The strongest objections, and my answers
“You are using hindsight. The five months only exist because we later sequenced backward. No one could have known in November 2023.” Correct on the epistemics and wrong on the implication. I am not claiming anyone possessed the knowledge in November 2023; I am measuring how long the system took to acquire knowledge that was, in principle, acquirable, because observable fragments existed in the world during that interval. That is what TTK is for. And the retrospective character of the measurement is a feature: it is the only honest way to score a surveillance system, and it is precisely why systems that score themselves from first detection forward always look better than they are.
“Cattle are not people. Nothing in your Part I architecture is supposed to see a cow, so you have proven only that the human system does not do a job it was never given.” That is the argument, stated better than most critics will state it. The job was never given to anyone. A pathogen crossing from birds to cattle to a dairy worker traverses three custodial regimes and no statute assigns anyone the assembled view. Part IV is entirely about that seam, and GAO’s own expert panel identified unifying animal and human surveillance as a priority action in July 2026.
“One case is not evidence. You picked the case that fits.” I picked the best-documented recent case, which is also the one where the onset date is independently measurable, which is what makes the exercise possible at all. That is selection on measurability, and I have disclosed it. The remedy is not for me to assert generality; it is Section VI, where I ask readers to run the same clocks on their own events and tell me where I am wrong. If a substantial set of well-documented events shows pipeline latency dominating, the thesis is in trouble and should be.
“The response after detection was fast, which shows the system works.” It shows the response system works, and I credited it with specific numbers because it does. The argument of this series was never that America responds slowly once it knows. It is that America takes months to know, and that the knowing function has no owner. A fast response to a late start is precisely the signature I would expect from an architecture with excellent components and no assembler.
“TTK and TTA are your invented metrics. Nobody reports them, so they cannot be used.” True today, and that is the point of naming them. They are reconstructable from records that already exist, they are auditable after the fact, and they measure the thing decision-makers actually experience rather than the thing pipelines are optimized for. If an institution wants to demonstrate that its picture assembles faster than I claim, these two numbers are how it would do it. I would welcome the argument.
NEXT IN NO COMMON OPERATING PICTURE
Part IV, “The One Health Blind Spot.” This clock kept stopping at one boundary. Next week I take the seam between animal and human health directly: why a biological event cannot be understood from human data alone, why the animal side answers to agriculture in nearly every country on Earth for reasons that are 140 years old, and what the government’s own experts said about it in July 2026. Some older history becomes relevant here, and I will say why when we get there.
A Risk Factor investigation into why the United States cannot reliably transform biological data into operational public health intelligence, and how to fix it.
REFERENCES
[1] Huff, A. G. “Flying Blind,” No Common Operating Picture, Part I, Risk Factor, 2026. LINK TO ARTICLE
[2] Huff, A. G. “The Fragmentation Machine,” No Common Operating Picture, Part II, Risk Factor, 2026. LINK TO ARTICLE
[3] Nguyen, T. Q., et al. “Emergence and interstate spread of highly pathogenic avian influenza A(H5N1) in dairy cattle in the United States,” Science, 2025 (single spillover event in late 2023; initial outbreak spanning 26 dairy premises in eight states). https://www.science.org/doi/10.1126/science.adq0900
[4] “The emergence and molecular evolution of H5N1 influenza viruses in United States dairy cattle,” preprint, 2026 (Bayesian phylodynamic estimate of B3.13 spillover: late October 2023, 95 percent HPD 30 September to 22 November 2023; months of cryptic transmission prior to detection). https://www.biorxiv.org/content/10.64898/2026.03.30.713641v1
[5] Nature, “The global H5N1 influenza panzootic in mammals,” 2024 (single introduction into cattle estimated late 2023 or early 2024). https://www.nature.com/articles/s41586-024-08054-z
[6] USDA APHIS, confirmation of HPAI H5N1 clade 2.3.4.4b genotype B3.13 in a dairy cow in Texas by National Veterinary Services Laboratories, 25 March 2024; confirmed cases in livestock. https://www.aphis.usda.gov/livestock-poultry-disease/avian/avian-influenza/hpai-detections/hpai-confirmed-cases-livestock
[7] USDA and HHS, “USDA, HHS Announce New Actions to Reduce Impact and Spread of H5N1,” 10 May 2024 (first confirmed human case associated with the outbreak reported by Texas on 1 April 2024; Federal Order issued 24 April, effective 29 April). https://www.usda.gov/about-usda/news/press-releases/2024/05/10/usda-hhs-announce-new-actions-reduce-impact-and-spread-h5n1
[8] USDA APHIS, Federal Order of 24 April 2024 requiring pre-movement influenza A testing at NAHLN laboratories for lactating dairy cattle moving interstate, effective 29 April 2024, and mandatory reporting of positive results. https://www.aphis.usda.gov/sites/default/files/dairy-federal-order.pdf
[9] USDA APHIS, National Milk Testing Strategy Federal Order, December 2024; first round of silo testing beginning the week of 16 December 2024. https://www.aphis.usda.gov/livestock-poultry-disease/avian/avian-influenza/hpai-detections/livestock/nmts
[10] The Independent Panel for Pandemic Preparedness and Response, “COVID-19: Make It the Last Pandemic,” May 2021. https://theindependentpanel.org/mainreport/
[11] U.S. Government Accountability Office, GAO-26-107610, “Public Health Preparedness: Experts Identified Actions to Improve Surveillance for Emerging Disease Threats,” released 30 July 2026. https://www.gao.gov/products/gao-26-107610
[12] Hoffmann, B., et al. “Novel orthobunyavirus in cattle, Europe, 2011” (Schmallenberg virus identified by metagenomic sequencing following field reports of unexplained losses), Emerging Infectious Diseases. https://wwwnc.cdc.gov/eid/article/18/3/11-1905_article
[13] Statens Serum Institut, Danish Microbiology Database (MiBa), automatic national collection of all clinical microbiology results since 2010. https://mibaen.ssi.dk/
Note on figures. Four figures accompany this installment. Captions appear inline above and follow the house convention: sourced values are named to their source, assessed segmentation is labeled as assessed, and any illustrative geometry is declared schematic. Figure 3 is the load-bearing one; its onset estimate and confirmation date are sourced, and its internal segmentation of the interval is my assessment, not a measurement.