

Epidemiologist. Security engineer. Former Q-cleared scientist, Sandia National Laboratories. Ph.D. in Environmental Health Science, Emerging Infectious Disease and Epidemiology, DHS Center of Excellence Research Fellow. Former U.S. Army infantryman.
Bottom Line Up Front. Seven judgments, scored 0 to 100 on confidence, with evidence graded known, assessed, or unknown throughout.
1. A meaningful share of chronic disease is caused by infection, and the causal chains are among the best established in medicine. Four pathogens alone account for roughly 90 percent of the world’s two-plus million infection-attributable cancers each year (confidence 95, IARC).
2. In the United States specifically, that share is small. Fewer than 5 percent of American cancers are attributable to infection, and cardiometabolic conditions dominate the domestic chronic disease burden. Any argument that pretends otherwise is lying to you (confidence 90; the infection-attributable cancer fraction is IARC's own regional breakdown, the cardiometabolic prevalence is BRFSS).
3. The infection-attributable fraction is nonetheless the most actionable fraction, and that is the entire point. A cause with a vaccine or a ten-day antibiotic course is worth more per unit of burden than a diffuse multifactorial one. You cannot prescribe a cure for sedentary life. You can eradicate H. pylori in ten days (confidence 85; this is my judgment, not a finding).
4. The current chronic disease agenda is dismantling the machinery that acts on that fraction. HHS rewrote the childhood schedule by internal assessment in January 2026, cutting HPV to a single dose and bypassing the advisory process entirely, and in March 2026 a federal court stayed both that schedule and the reconstituted advisory committee's appointments and votes. Measles has reached 2,566 confirmed cases as of August 13, following a 2025 total of 2,289 that was itself the highest since 1991, and the country's elimination status faces review in November.
5. The harm is real and mostly invisible, because it arrives on a 20-to-40-year lag. Cancers prevented are never counted, and cancers caused by prevention withdrawn will not appear in any dashboard before 2050 (confidence 85).
6. The omission is not an accident of attention. It is the predictable output of a reasoning method that runs on temporal correlation, single villains, and unfalsifiable framing. That method cannot find infectious causation even when the evidence is randomized, because a cause that arrives with a vaccine is a cause the method is built to reject (confidence 85; this is an argument about method, made falsifiable below).
7. Dismantling infectious disease surveillance, across every transmission pathway, foodborne, waterborne, respiratory, vector-borne, sexual, congenital, healthcare-associated, and zoonotic, is chronic disease policy, whether anyone admits it or not. Ordinary foodborne and waterborne infections seed Guillain-Barre paralysis within weeks, and kidney damage, hypertension, and irritable bowel syndrome years after the diarrhea resolves; the national radar that catches outbreaks early is being defunded, a five-state Cyclospora outbreak having run this summer; and surveillance already sees only a fraction of what occurs, roughly one reported case for every 147 in the community, by the best UK estimate.
The crisis is real
Start where the movement is right. American chronic disease is not a manufactured panic. By CDC’s current accounting, 3 in 4 US adults carry at least one chronic condition and more than half carry two or more [1]. The surveillance behind that number is not soft: in 2023, 76.4% of adults, about 194 million people, reported at least one of eleven measured conditions. High cholesterol stood at 35.3%, hypertension at 34.5%, obesity at 32.7%, diabetes at 12.1% [2]. The trend line among the young is the part that should keep policymakers awake. Over the decade from 2013 to 2023, obesity among adults 18 to 34 rose from 22.1% to 27.3%, and depression in the same group rose from 16.4% to 25.0% [2].
Hold that against the mortality data and the paradox sharpens. Life expectancy hit 79.0 years in 2024, an all-time American high, with the age-adjusted death rate down 3.8% in a single year [3]. Heart disease still killed 683,491 people and cancer 619,876 [3]. We are living longer and carrying more disease while we do it. A movement that promises to attack the causes of that burden deserves a hearing.
So give it one. Then ask the only question that matters in cause-of-disease work: which causes have the strongest causal evidence, and is the movement acting on them?
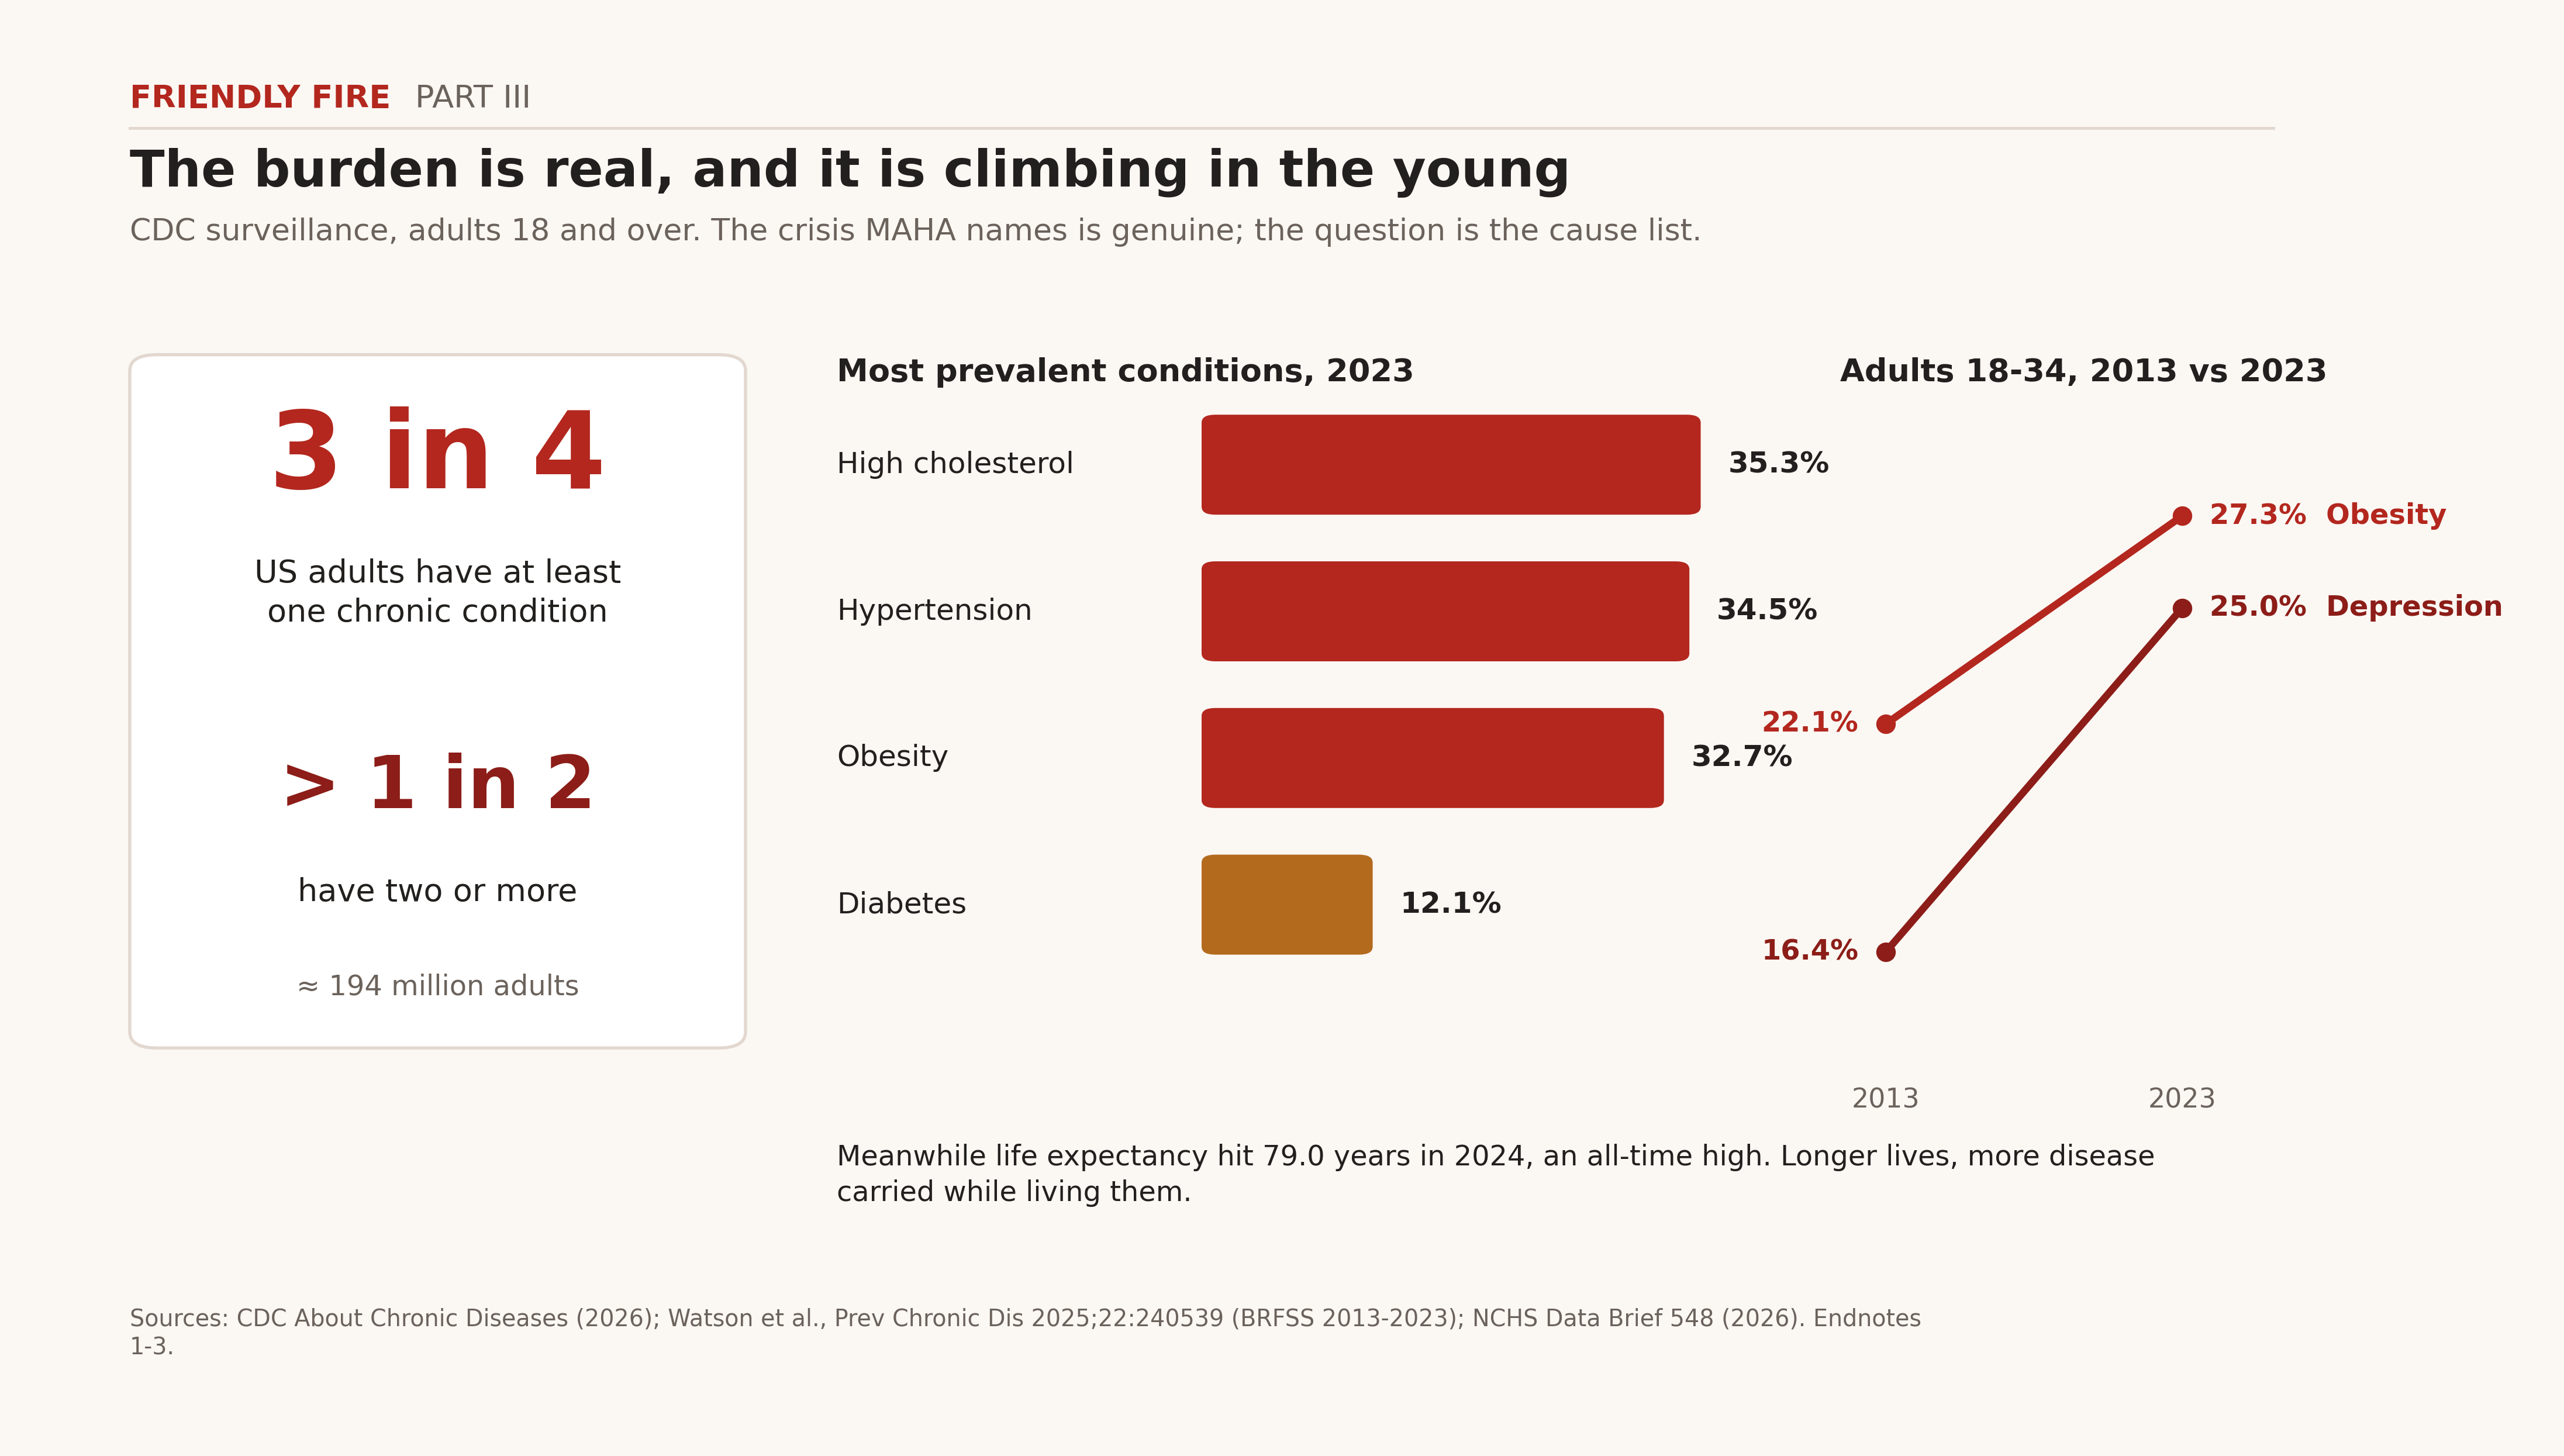
Figure 1. The chronic disease burden is real and climbing fastest among young adults. CDC BRFSS 2013-2023; NCHS 2026.
The cause with the receipts
There is a category of chronic disease causation that does not rest on food-frequency questionnaires, ecological correlations, or mouse livers. It rests on randomized trials, natural experiments at national scale, dose-response, mechanism, and reversal when you remove the exposure. That category is infection.
The International Agency for Research on Cancer counts eleven infectious agents as Group 1 carcinogens: one bacterium, seven viruses, three macroparasites [5]. In 2018, infections accounted for 2.2 million of the world’s roughly 18 million new cancers, about one case in eight [6]. Helicobacter pylori alone accounts for about 810,000 cancers a year, including 89% of non-cardia gastric cancer. HPV accounts for about 690,000, hepatitis B for 360,000, hepatitis C for 160,000 [6]. In the United States the infection-attributable fraction of cancer runs under 5%, against more than 50% in parts of sub-Saharan Africa [4]. That gap is not biology. It is vaccination, screening, antivirals, and sanitation. It is what winning looks like, and it is recent, and it is reversible.
Cancer is only the audited slice. The same causal logic now runs through multiple sclerosis, dementia, heart disease, diabetes, asthma, and the gut. The receipts follow.
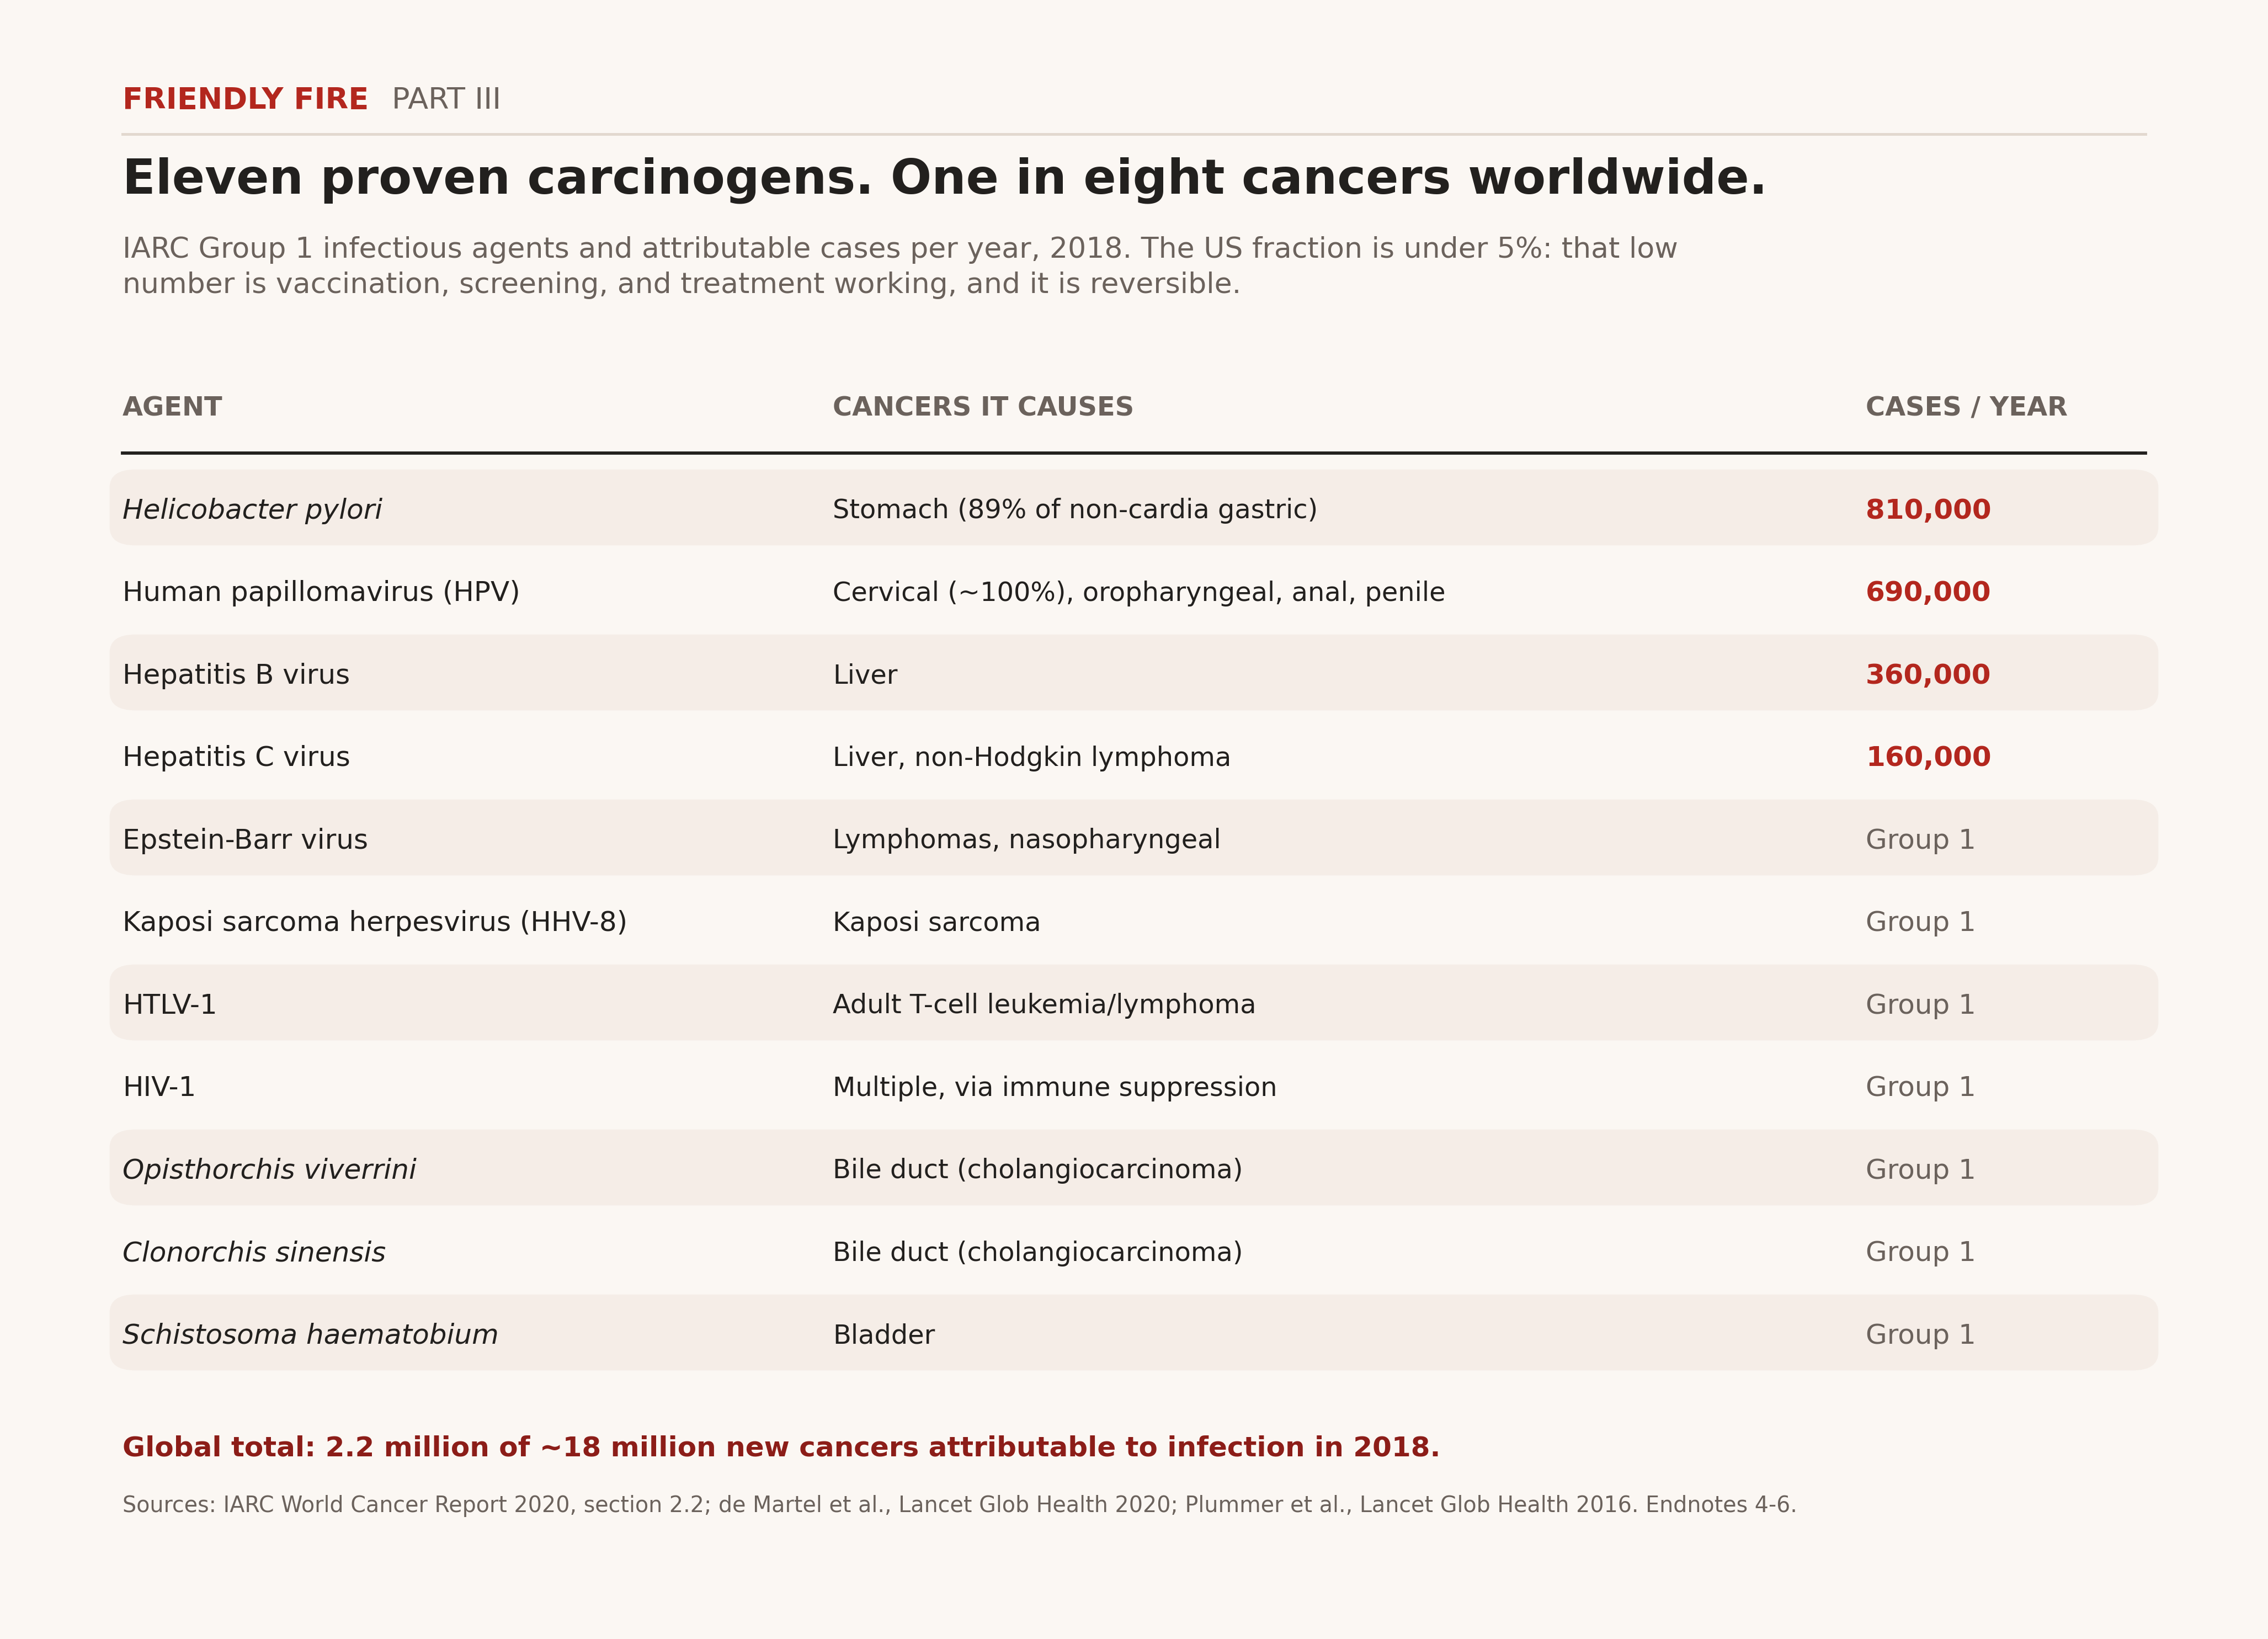
Figure 2. IARC Group 1 infectious carcinogens and infection-attributable cancer, 2018.
What acting on a cause looks like
Eradicate H. pylori in people with a family history of gastric cancer and you cut their cancer incidence by more than half: 1.2% versus 2.7% over a median 9.2 years, hazard ratio 0.45, in a randomized placebo-controlled trial [7]. The pooled trial literature agrees: relative risk 0.54, one cancer prevented for every 72 people treated, with the honest caveat that the trials ran in East Asian populations and the certainty is moderate [8]. That is what a modifiable cause of chronic disease looks like when you modify it.
HPV is the cleaner story because the chain runs unbroken from molecule to national statistics. HPV DNA is present in 99.7% of cervical cancers; IARC treats the cervical attributable fraction as 100% [9]. England offered the vaccine to girls at 12 and 13 and watched their cervical cancer rate fall 87% relative to unvaccinated cohorts, with an estimated 448 cancers and 17,235 cases of CIN3 prevented by mid-2019 [10]. Sweden followed 1.67 million girls and women and found an incidence rate ratio of 0.12 for those vaccinated before 17 [11]. And now the American data have arrived: cervical cancer incidence among US women aged 20 to 31 fell 27% comparing the vaccine era with the pre-vaccine era, and every 10 percentage point increase in a state’s vaccination coverage bought an 11.5% faster decline in that state’s rate. States that vaccinated, won. States that did not, did not [12].
Here is the part the movement never mentions. Oropharyngeal cancer, also HPV-driven, surpassed cervical cancer in 2015 as the most common HPV-associated cancer in the United States: 18,917 cases against 11,788, rising 2.7% per year in men [13]. There is no screening test for it. No Pap smear, no early-detection program. For an entire class of male cancer, prevention is the vaccine or nothing.
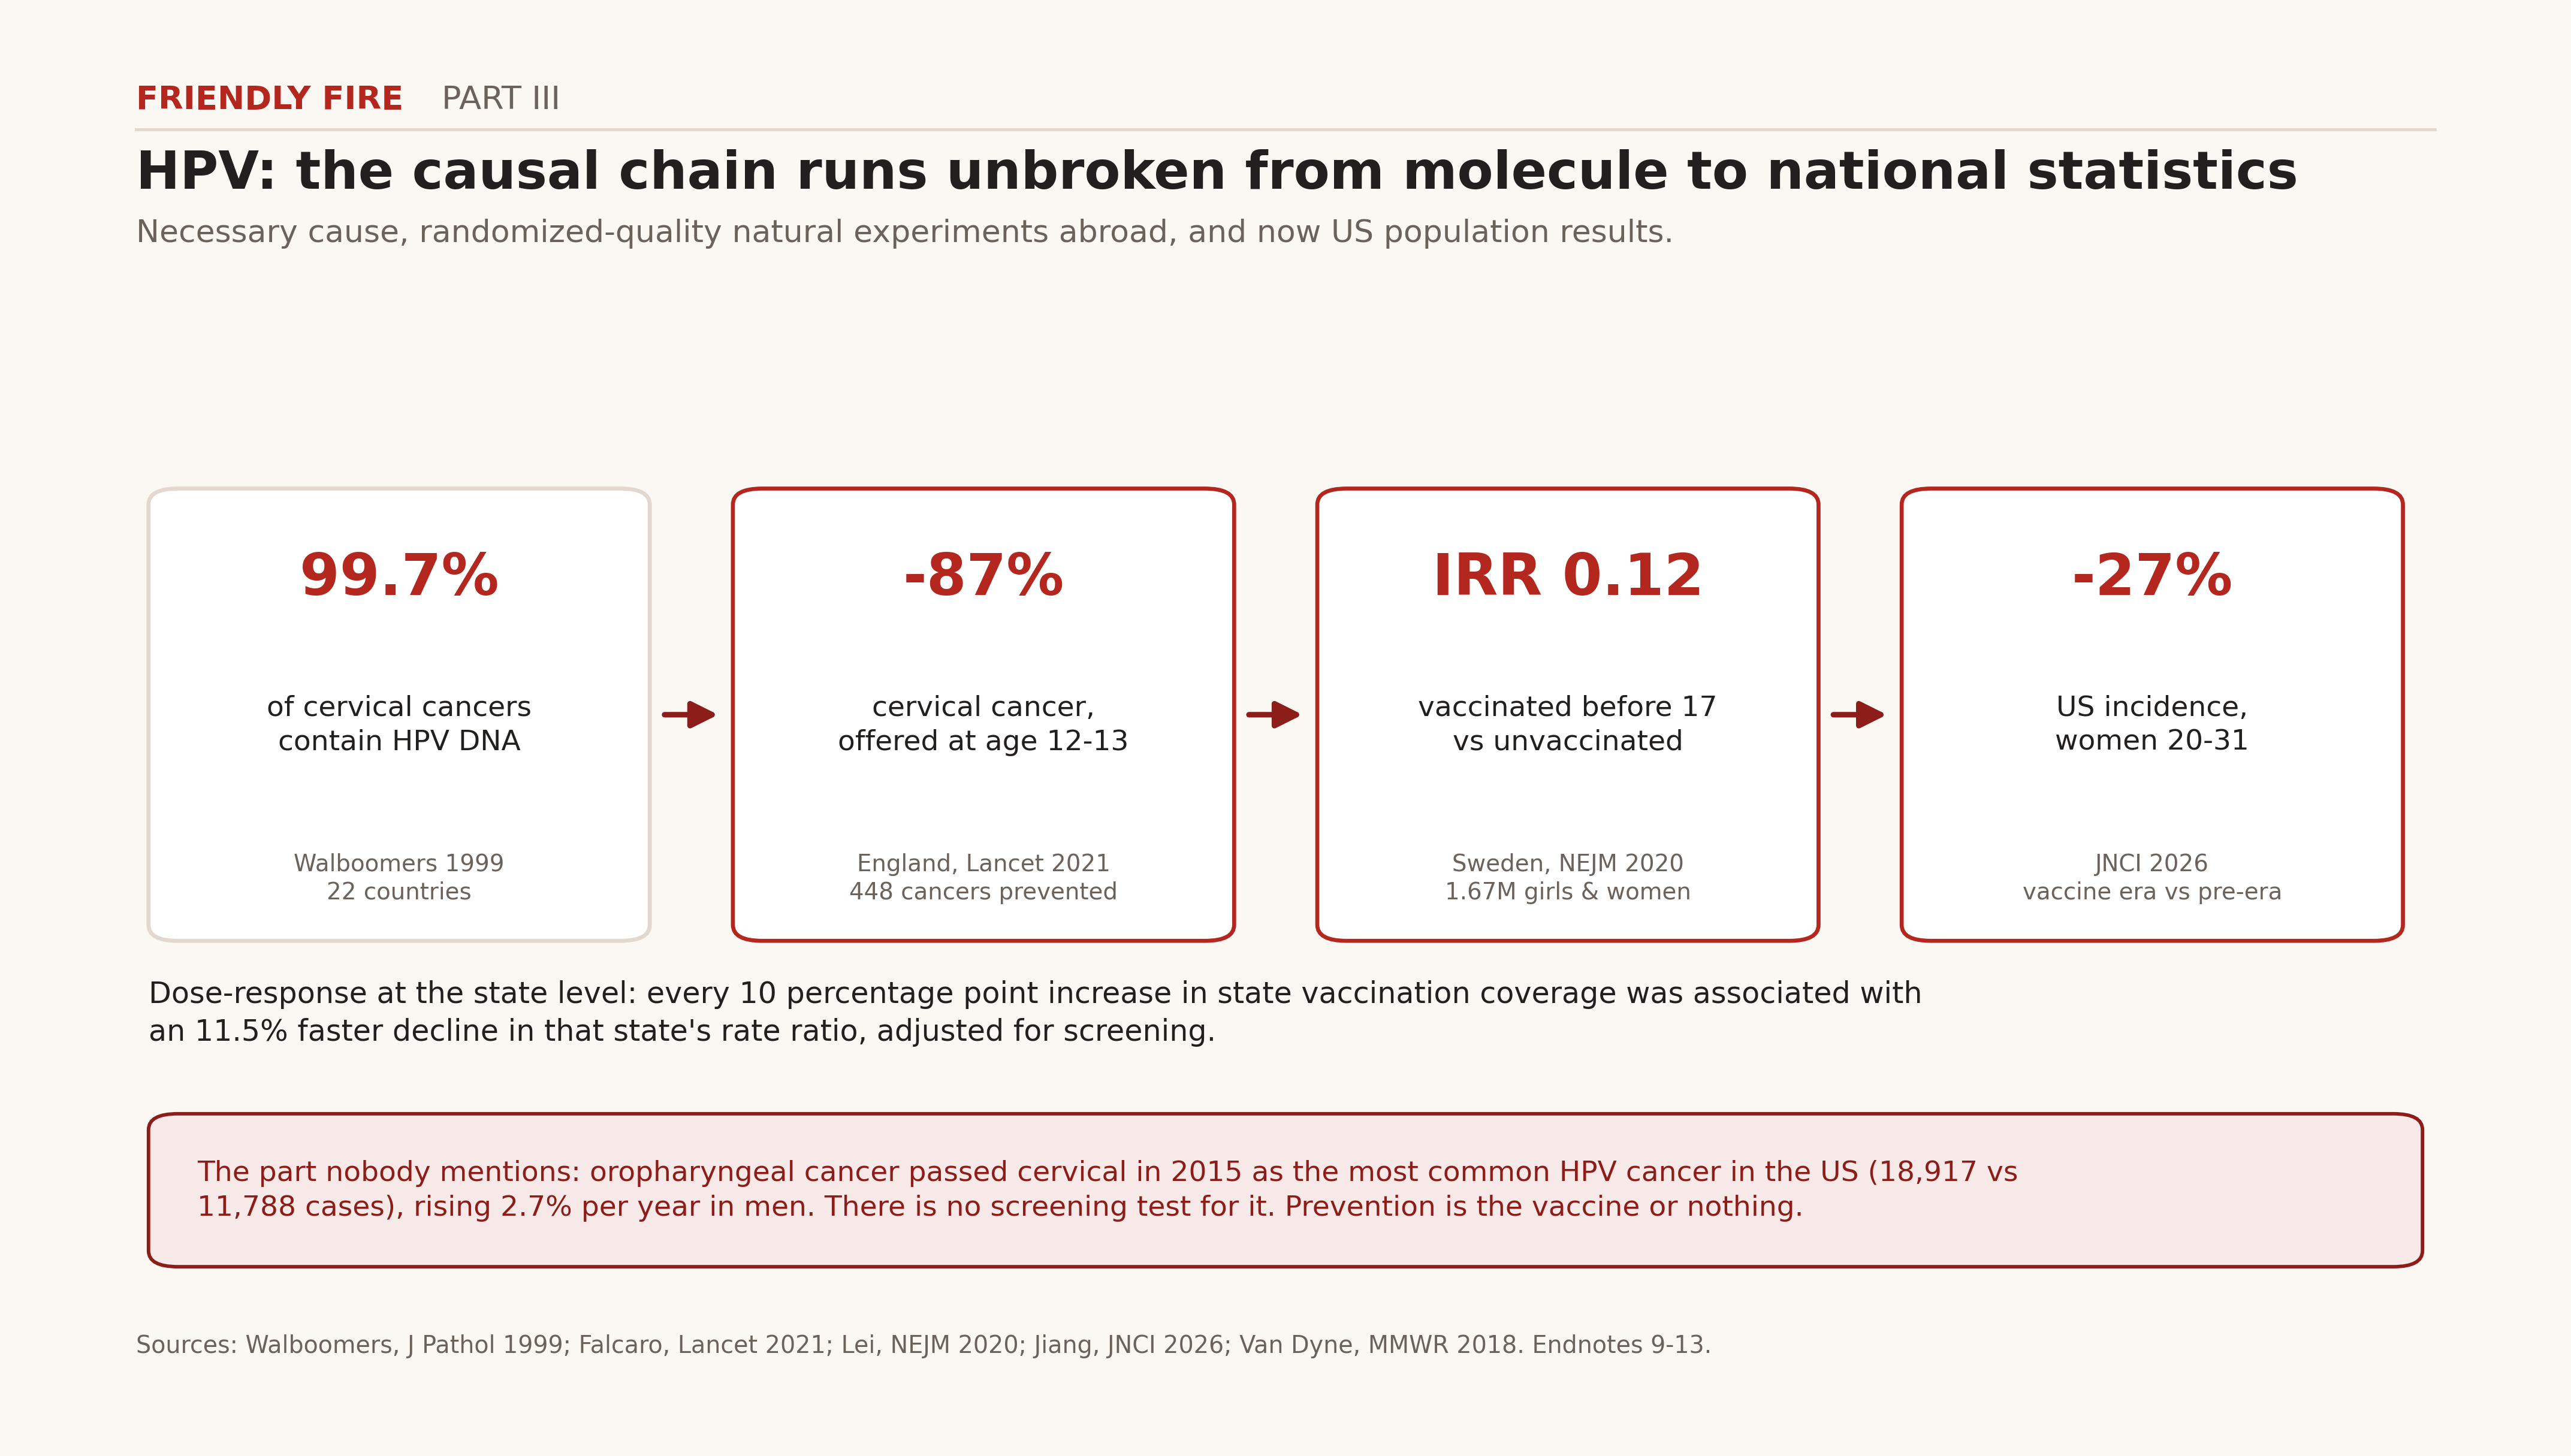
Figure 3. The HPV causal chain, from molecular necessity to US population impact.
The frontier keeps widening
Multiple sclerosis. In 2022, Harvard researchers used serial blood samples from more than 10 million US military service members to run the study skeptics had demanded for decades. Among 801 MS cases with adequate samples, 35 were EBV-negative when they enlisted; 34 of the 35 seroconverted before their MS began. The hazard ratio for MS after EBV infection was 32.4. Cytomegalovirus, transmitted the same ways, showed nothing, and the neuronal damage marker in serum rose only after EBV arrived, not before [14]. Mechanism followed within weeks: clonally expanded B cells from MS patients bind both EBV’s EBNA1 protein and the brain protein GlialCAM, molecular mimicry documented in a subset of patients [15]. The therapeutic race is on and honest people report the losses: Atara’s T-cell therapy missed its phase 2 endpoint, 6% improvement against a 16% placebo response [16]. Moderna’s EBV vaccines are in trials with primary completions expected in late 2026, and a phase 2 in early relapsing MS is underway with completion estimated in 2029 [17]. The first disease-modifying vaccine target in neurology is on the clock.
The heart. Rheumatic heart disease, the chronic destruction of heart valves that follows untreated strep throat, still afflicted an estimated 54.8 million people and killed roughly 373,000 in 2021. Age-standardized prevalence in Eritrea runs more than a hundred times Finland’s [18]. Where infections are treated, the chronic disease disappears. Where they are not, children grow into heart failure.
Dementia. Wales rolled out the shingles vaccine by date of birth, an arbitrary cutoff that created a natural experiment as clean as a trial: people born a week apart, 0.01% versus 47.2% vaccinated. Seven years later the vaccinated cohort’s dementia risk was 3.5 percentage points lower in absolute terms, a 20% relative reduction [19]. Canadian natural experiments replicate the signal [21]. A Kaiser Permanente cohort of 65,800 recipients of the newer recombinant vaccine reports 51% lower dementia risk, but treat that number the way I treat MAHA’s numbers: the comparison against active vaccinees attenuates it to 27%, and healthy-vaccinee bias explains the difference between observational enthusiasm and the quasi-randomized Welsh estimate [20]. No randomized trial has reported; one is registered [21]. The honest statement is that a vaccine plausibly prevents some dementia, the effect size is uncertain, and this is among the most important open questions in medicine.
Type 1 diabetes. Enterovirus detection is associated with islet autoimmunity at odds ratio 2.1, with clinical type 1 diabetes at 8.0, and within one month of diagnosis at 16.2 [22]. Read that gradient with discipline: rising odds toward diagnosis is exactly the signature of reverse causation and detection bias, so causality is unproven. The test is coming anyway. A coxsackievirus B vaccine cleared phase 1 safety with dose-dependent neutralizing antibodies [23]. If it prevents diabetes, a chronic disease becomes vaccine-preventable. If not, the hypothesis dies the way hypotheses should: in a trial, not on a podcast.
Asthma. Infants who escape RSV infection in the first year of life carry a 26% lower risk of asthma at age five; an estimated 15% of childhood asthma is attributable to infant RSV [24]. We now have the immunization tools to run that experiment at population scale.
The gut and beyond. A distinct Fusobacterium nucleatum clade dominates the colorectal tumor niche, though its taxonomy is already under peer-reviewed challenge, which is how science is supposed to work [25]. SARS-CoV-2 leaves measurable organ-system damage three years after infection in the VA cohort, with the caveat that veterans are older, more male, and sicker than the country [26]. And where the evidence is weak I will say so before any critic does: parvovirus B19 sits in myocardial biopsies of healthy hearts almost as often as diseased ones; its meta-analytic association holds for myocarditis but not dilated cardiomyopathy; the presence of a genome is not causation [27].
Every claim in this section survives the same knife I take to MAHA in Part II and below. That is the standard. Note what qualifies under it and what does not.
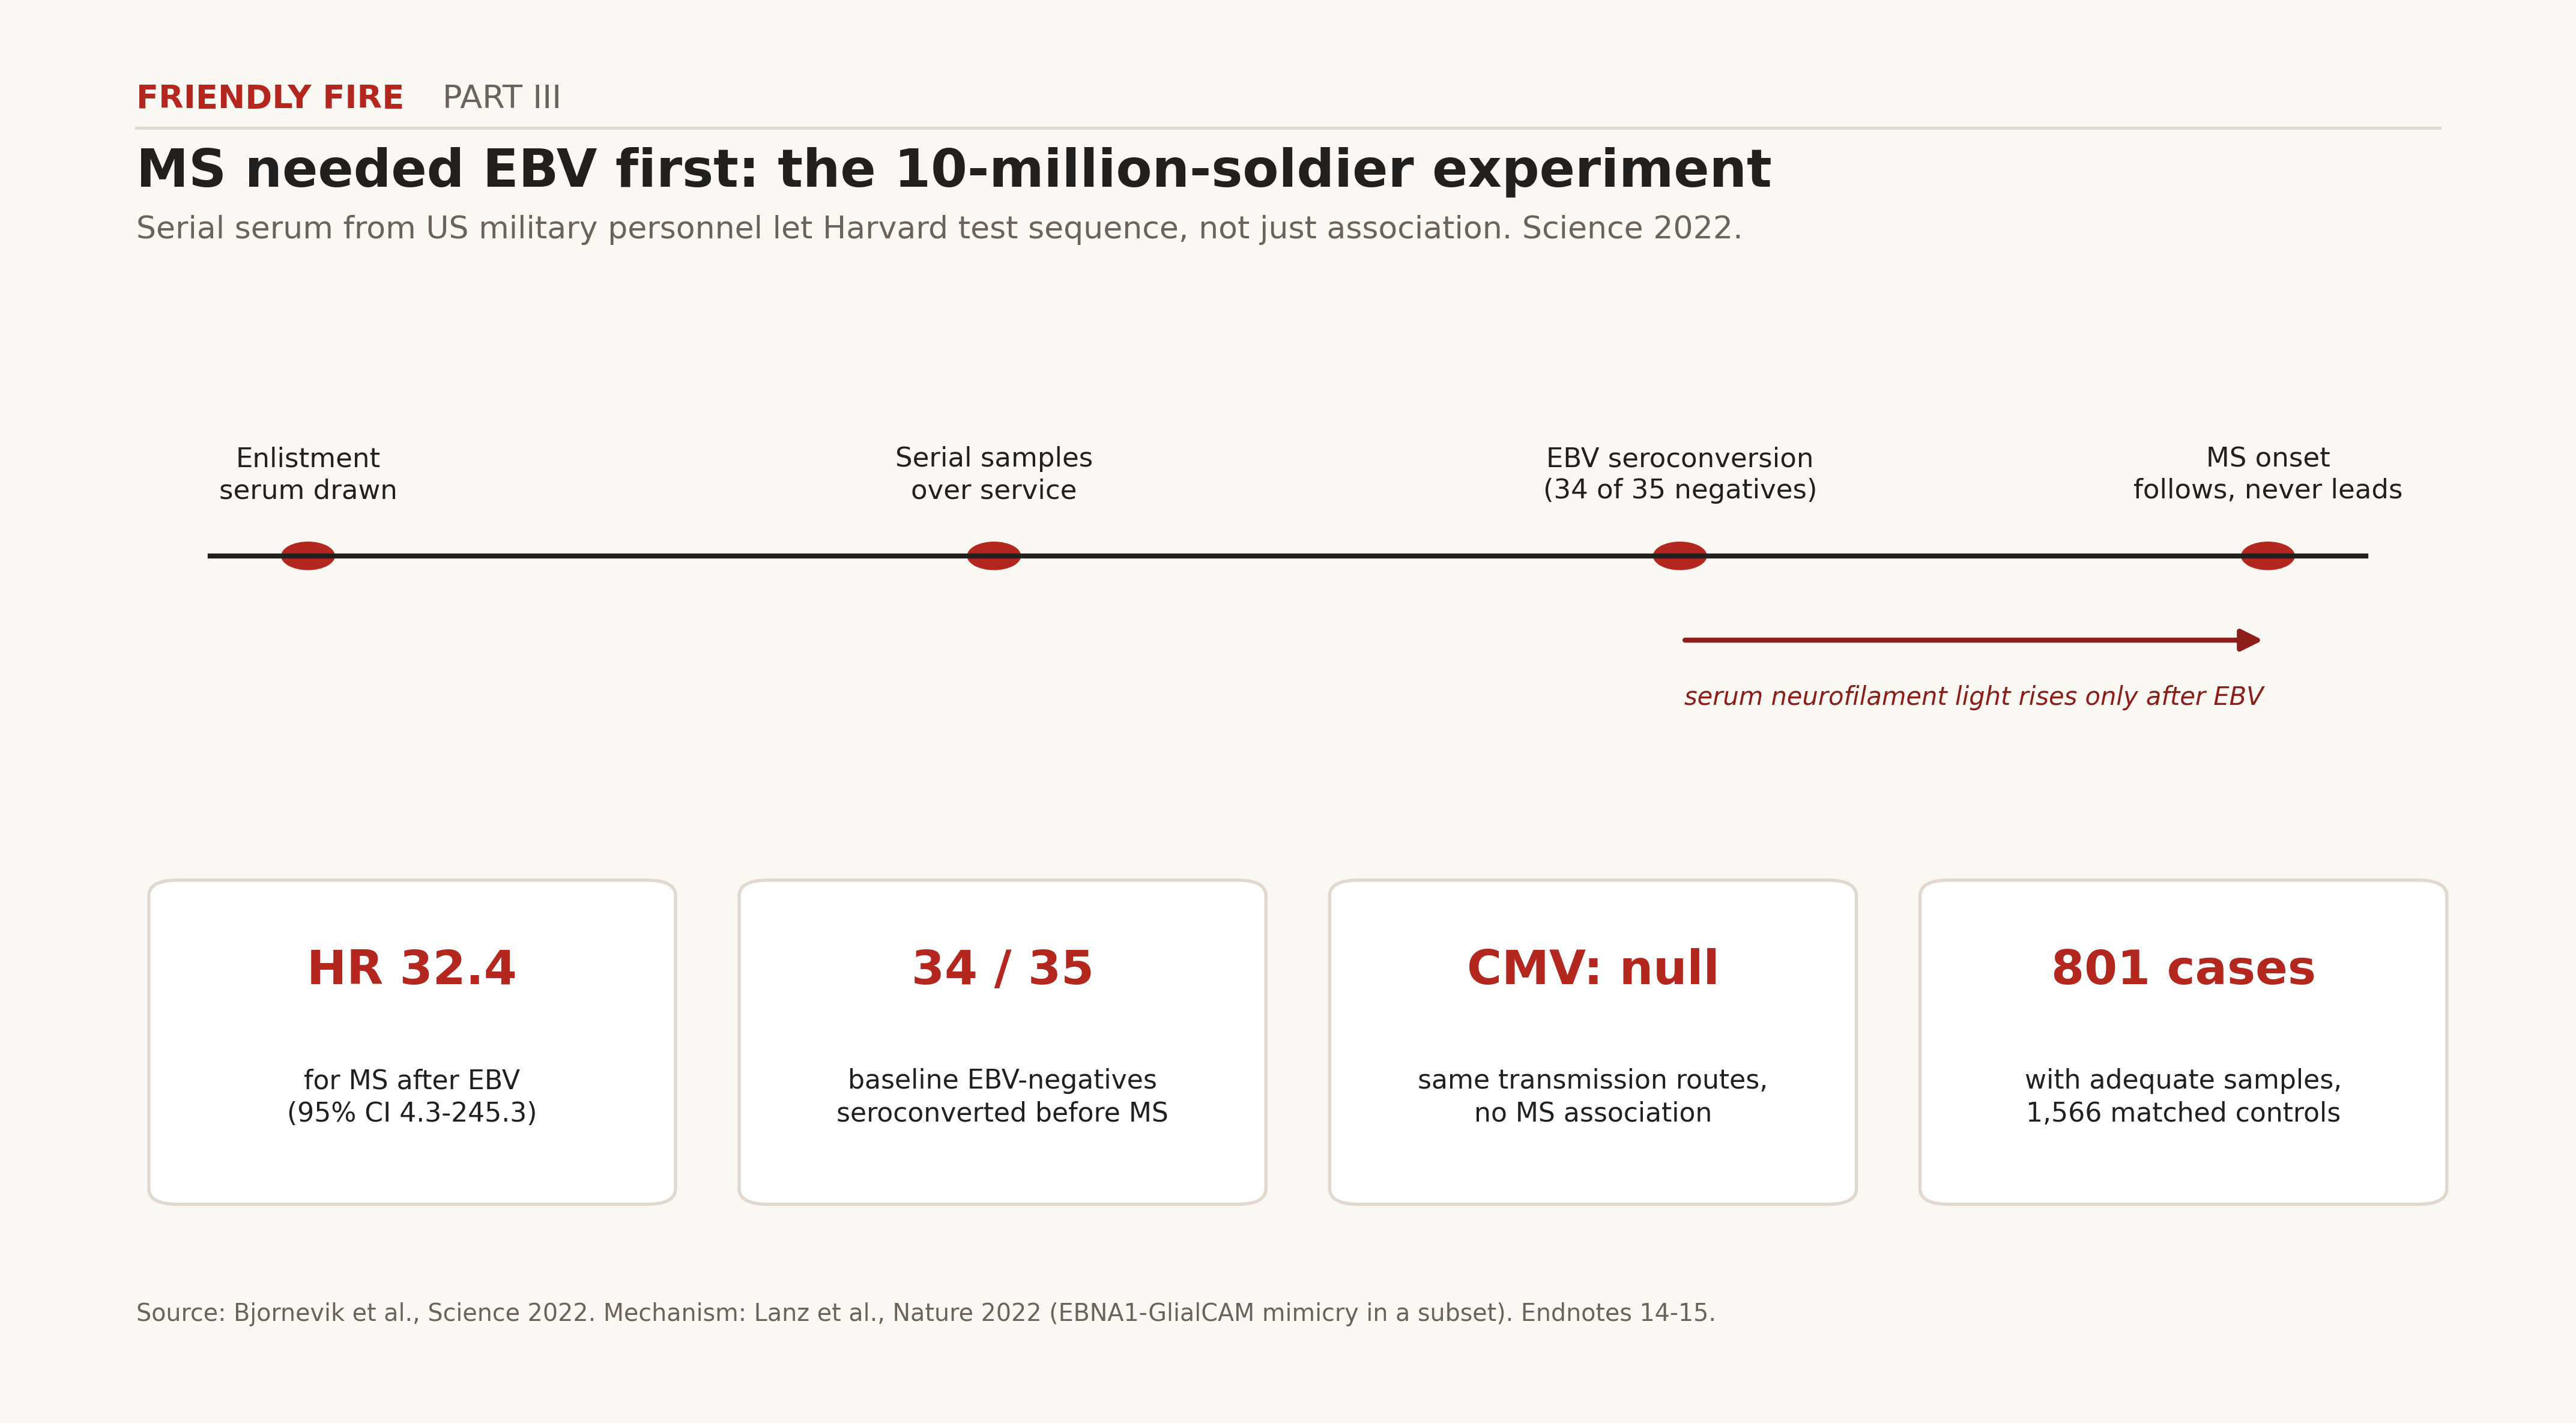
Figure 4. EBV and multiple sclerosis in the longitudinal military cohort (Science 2022).
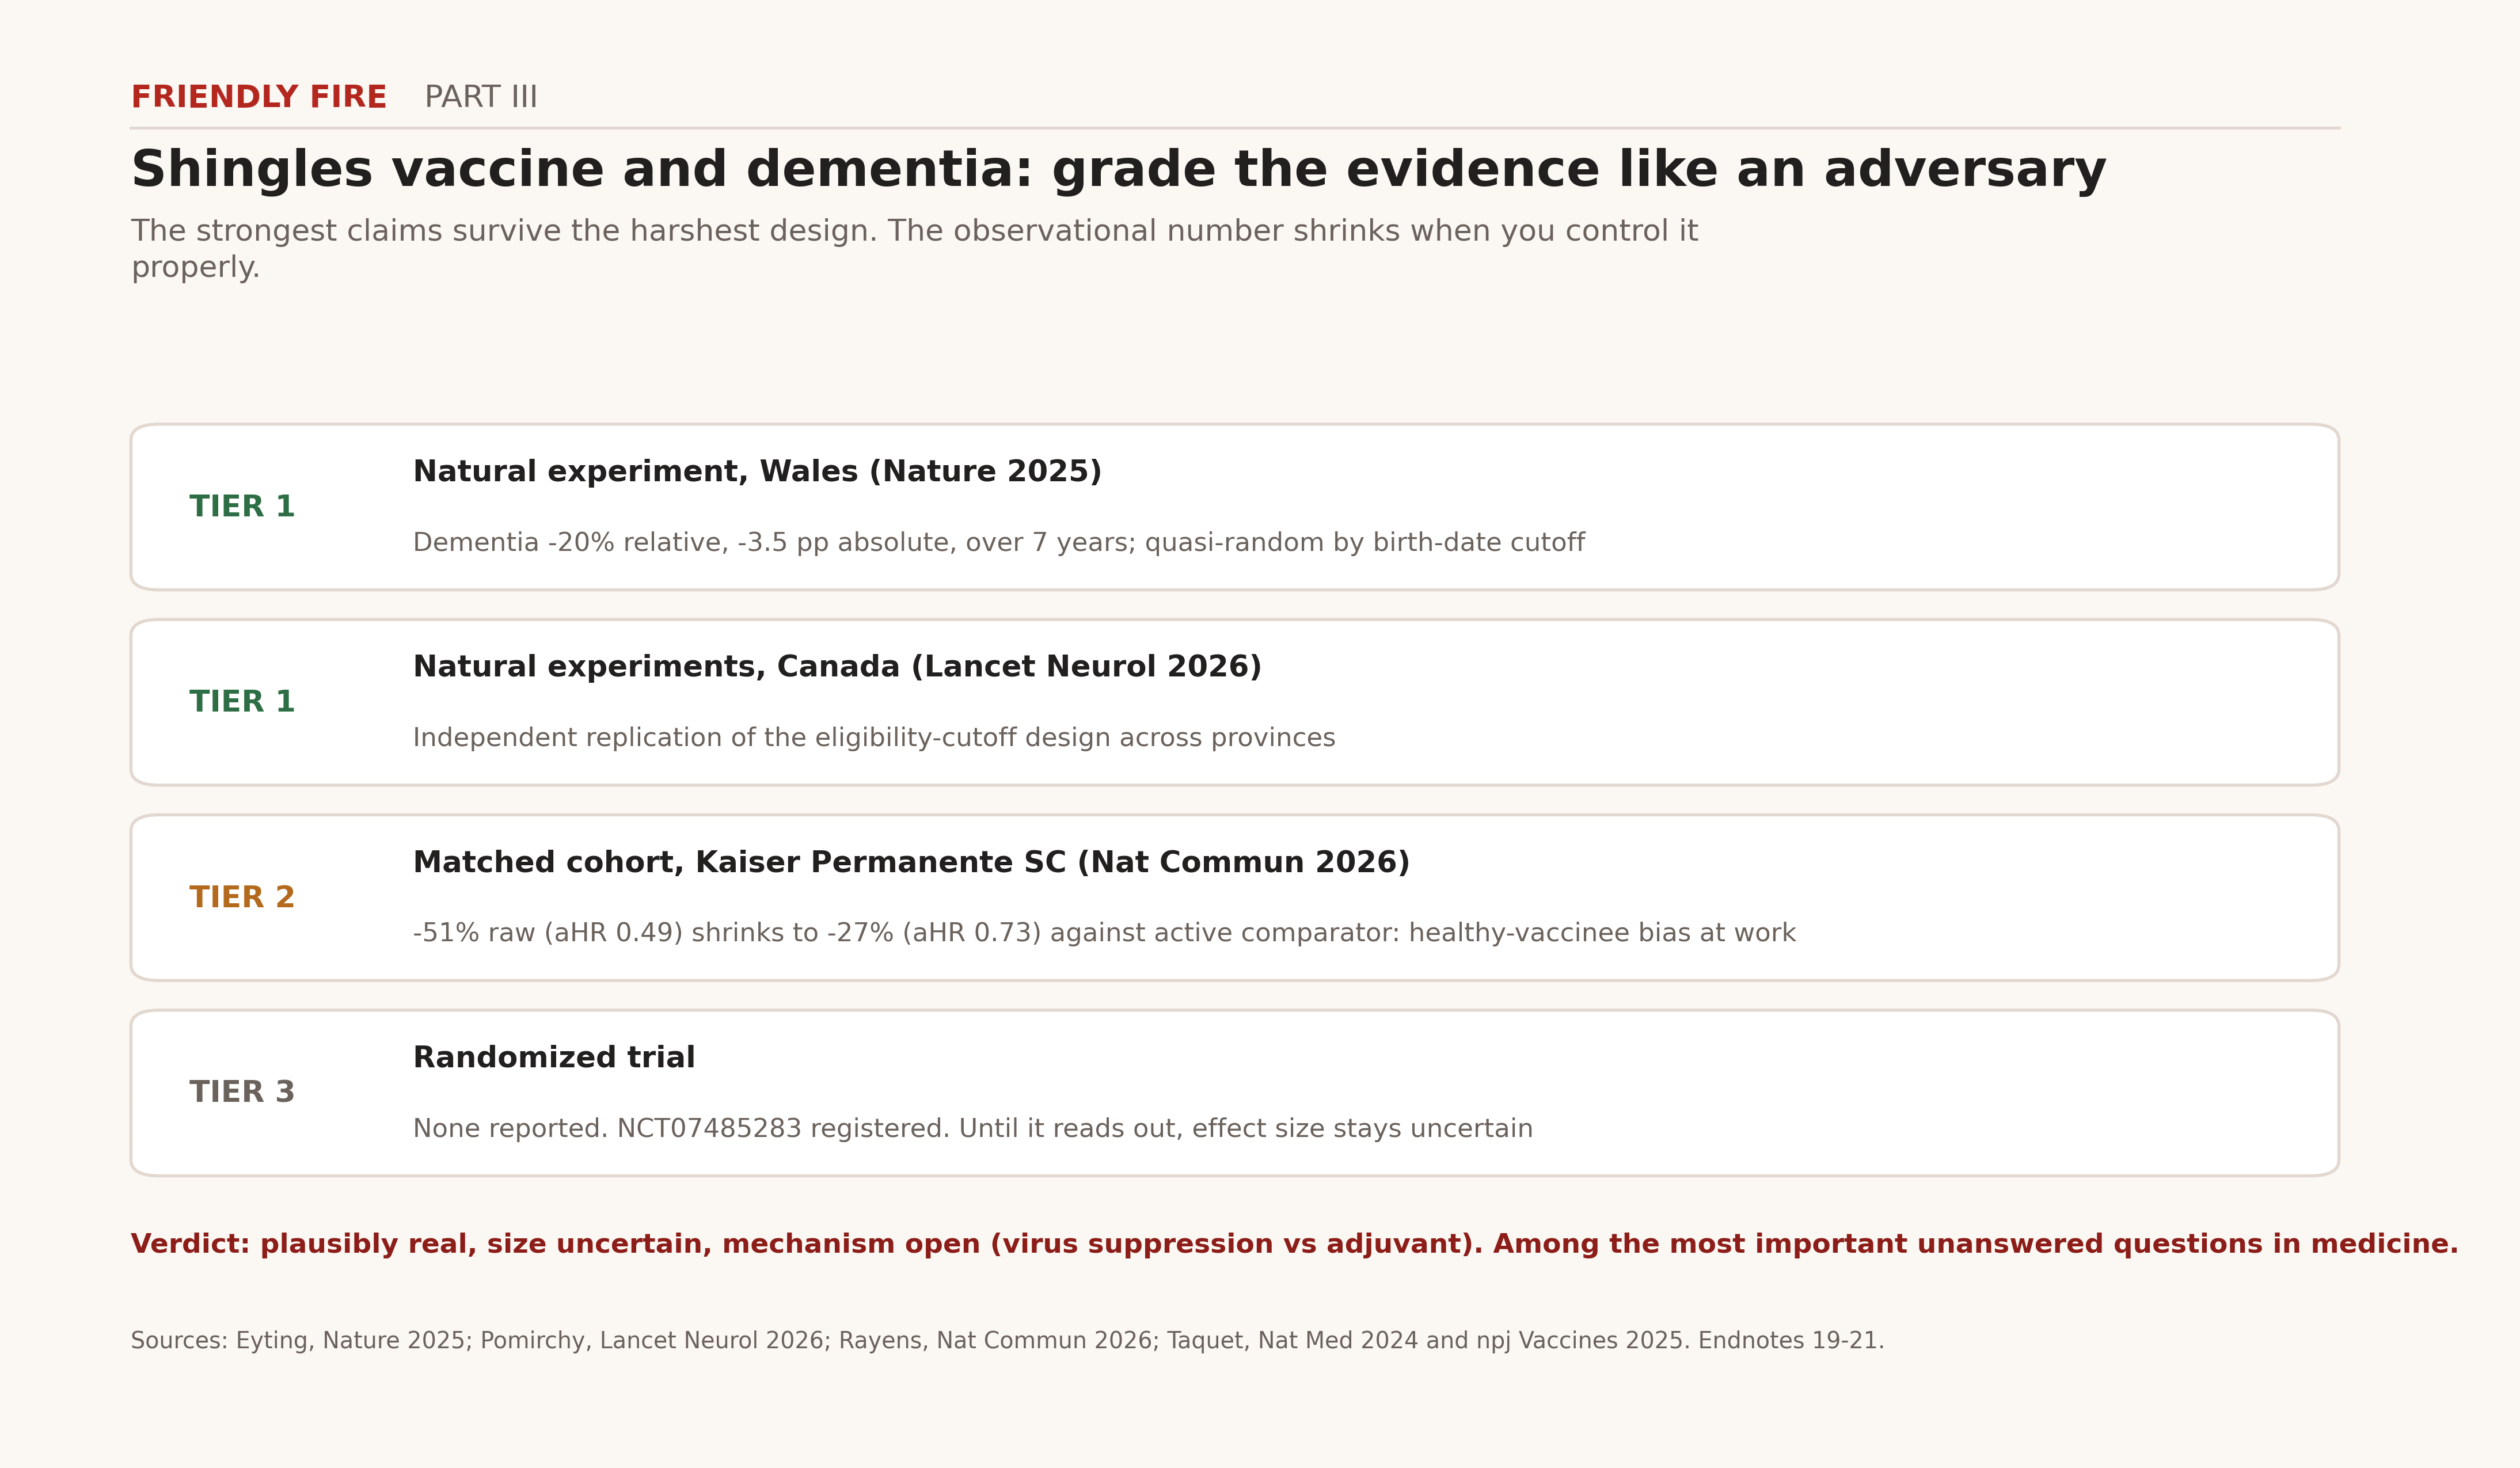
Figure 5. Zoster vaccination and dementia, with the evidence graded by study design.
Measles: running the experiment on ourselves
Measles is not a rash. It is an immune system reset. In unvaccinated Dutch children, measles eliminated between 11% and 73% of each child’s existing antibody repertoire; the median loss of pathogen-specific antibodies was 40% after severe measles and 33% after mild, and overall repertoire diversity dropped by roughly 20% on average. MMR vaccination caused no comparable loss [28]. The B-cell architecture itself is left incompletely reconstituted [29]. At population scale, measles epidemics historically dragged years of elevated all-cause childhood infectious mortality behind them, a finding that drew a published technical challenge and a published response, which is what real science looks like in public [30].
Now the experiment is running on American children. As of August 13, 2026, CDC counts 2,566 confirmed cases this year, 94% outbreak-associated, including 1,375 from chains of transmission that began in 2025 and never stopped. The 2025 total of 2,289 was the highest since 1991. Kindergarten MMR coverage has slid from 95.2% before the pandemic to 92.5%, roughly 286,000 kindergartners at risk [31]. In November 2025, the Pan American Health Organization determined that endemic transmission had re-established in Canada, and with it the entire Region of the Americas lost its status as measles-free [33]. The United States and Mexico face their own review in November 2026; the clock on the US analysis started January 20, 2025 [32]. Elimination took a generation to build. It is being spent in fiscal quarters.
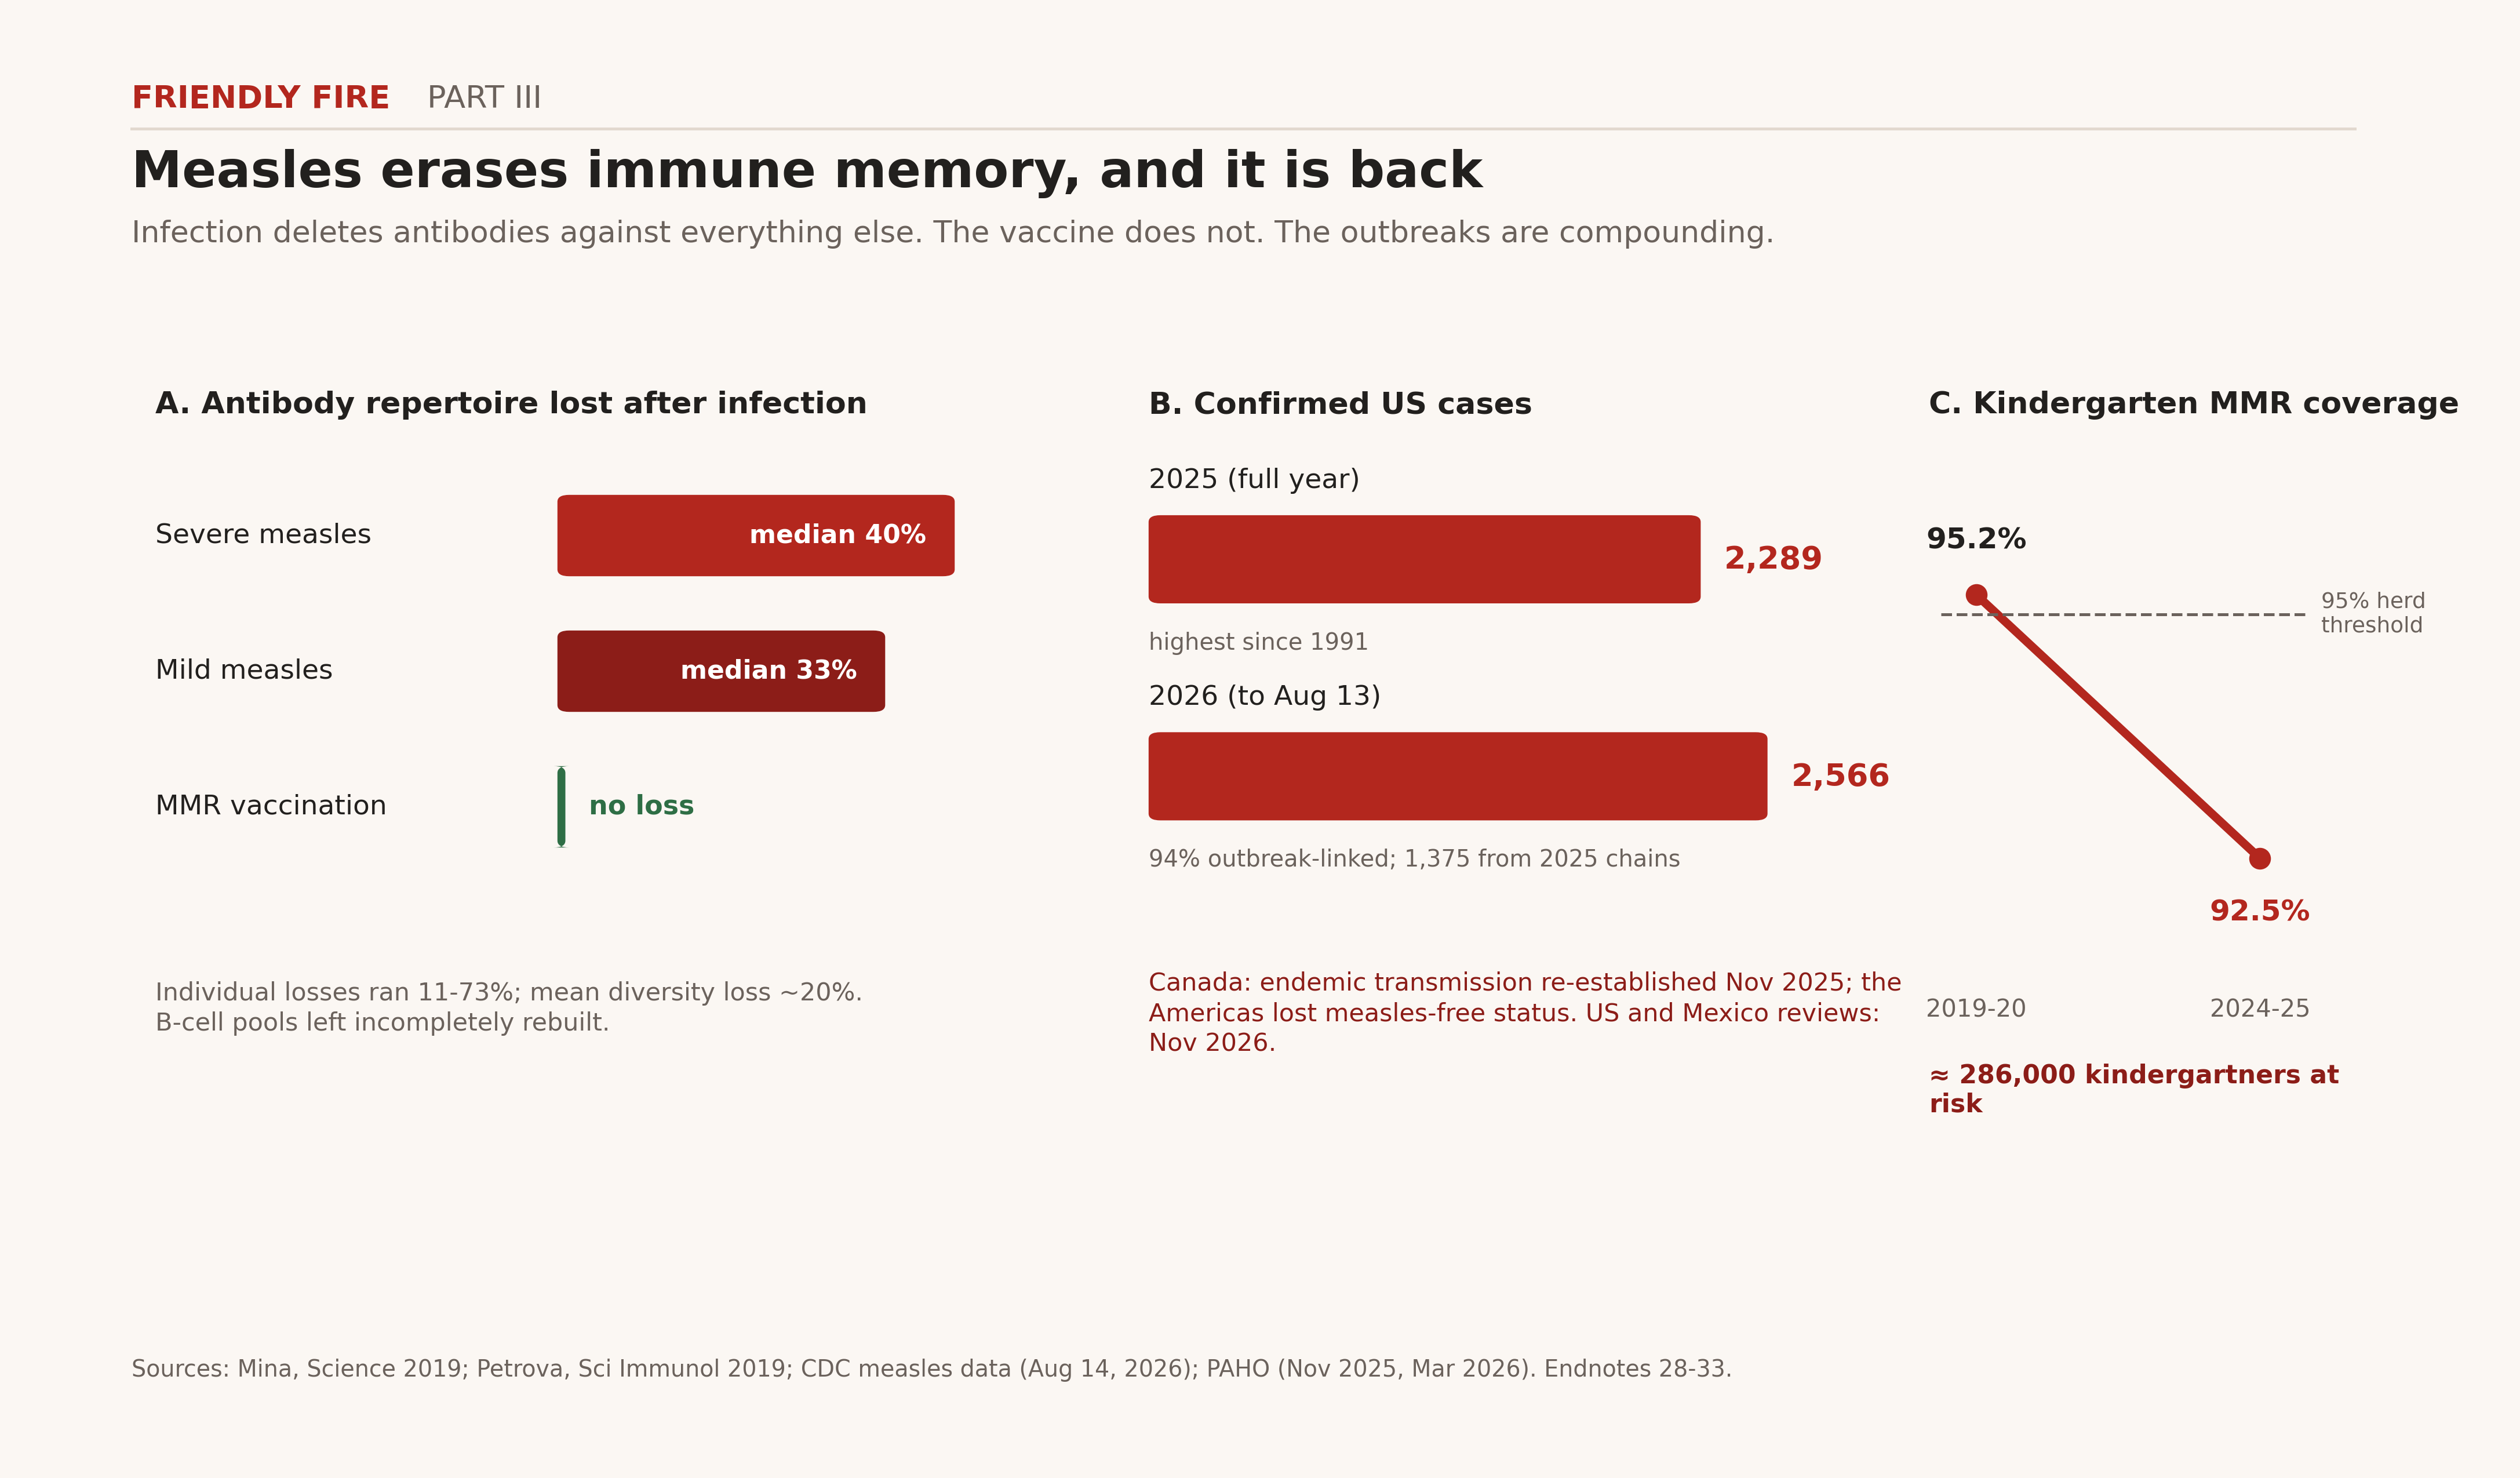
Figure 6. Measles immune amnesia and the 2025-2026 US resurgence.
The tell
If the chronic disease movement believed its own mission statement, everything above would be its agenda. Infection is the cause with the randomized trials, the natural experiments, the mechanisms, and the national-scale reversals. Acting on it costs nothing the movement claims to value. It requires only one concession: defending the vaccines and the institutions that deliver them.
Instead, on January 5, 2026, CDC announced a rewritten childhood schedule that narrowed the diseases targeted for universal vaccination, reduced the routine immunization list, and moved HPV vaccination to a single dose. The change was produced by an internal HHS assessment under a presidential directive. It was explicitly not an ACIP recommendation; the advisory process that has governed American immunization policy for six decades was bypassed [34]. On March 16, 2026, a federal court stayed the schedule, the appointments of thirteen ACIP members installed between June 2025 and January 2026, and every vote they cast, finding the committee’s reconstitution likely violated the Federal Advisory Committee Act. The government appealed on April 29. As of August 2026 the stay holds and the pre-January schedule governs [34].
Two facts to hold against the rhetoric. First, the sole cancer-prevention vaccine on the schedule was the one singled out for reduction. Second, the claimed crisis of collapsing HPV uptake does not exist in the surveillance: 78.2% of teens have at least one dose and 62.9% are up to date, flat since 2022, not falling [35]. The movement did not skip infection because the evidence is weak or the public refused it. It skipped infection because its coalition cannot survive saying the sentence “vaccines prevent chronic disease.”
The blind spot has a food-safety wing
The same movement that built its brand on food purity is dismantling the systems that catch actual foodborne disease, which causes actual chronic disease. Walkerton, Ontario, 2000: a contaminated water system, and eight years later the residents who got gastroenteritis carried a 33% higher rate of hypertension, 3.4 times the renal impairment, and 2.1 times the cardiovascular disease [36]. One episode of infectious enteritis leaves 10.1% of people with irritable bowel syndrome at a year or more, a fourfold elevation [37]. Campylobacter, the most common bacterial foodborne infection, triggers 5 to 41% of American Guillain-Barre cases at a rate of 0.2 to 1.7 per 1,000 infections; at six months, 20 to 40% of GBS patients still cannot walk independently, and 3 to 10% of GBS patients die [38]. Five to ten percent of diagnosed STEC O157 infections progress to hemolytic uremic syndrome, most often in children under five, and a lifetime of renal follow-up [39]. Globally, foodborne disease produces 600 million illnesses, 420,000 deaths, and 33 million disability-adjusted life years annually, sequelae included [40].
Surveillance is the only reason any of this is visible. For every case that reaches national reporting, 147 occur in the community [41]. PulseNet, the molecular network that connects scattered cases into outbreaks, costs about $7.3 million a year and returns roughly $544 million in averted costs: about 276,000 illnesses prevented annually through industry process changes, plus nearly 20,000 more from faster recalls [42]. Few programs in public health return anything close to that, and it is exactly the kind of infrastructure now on the block. This July, while the movement litigated food dyes, a five-state Cyclospora outbreak traced to iceberg lettuce sickened 1,644 people and hospitalized 94 [43]. Meanwhile the FY2027 budget request proposes cutting national wastewater surveillance from roughly $125 million to $25 million a year, the pathogen radar shrunk to a courtesy light. Proposed, not enacted, and worth fighting; Part I of this series documents the full surveillance contraction [44].
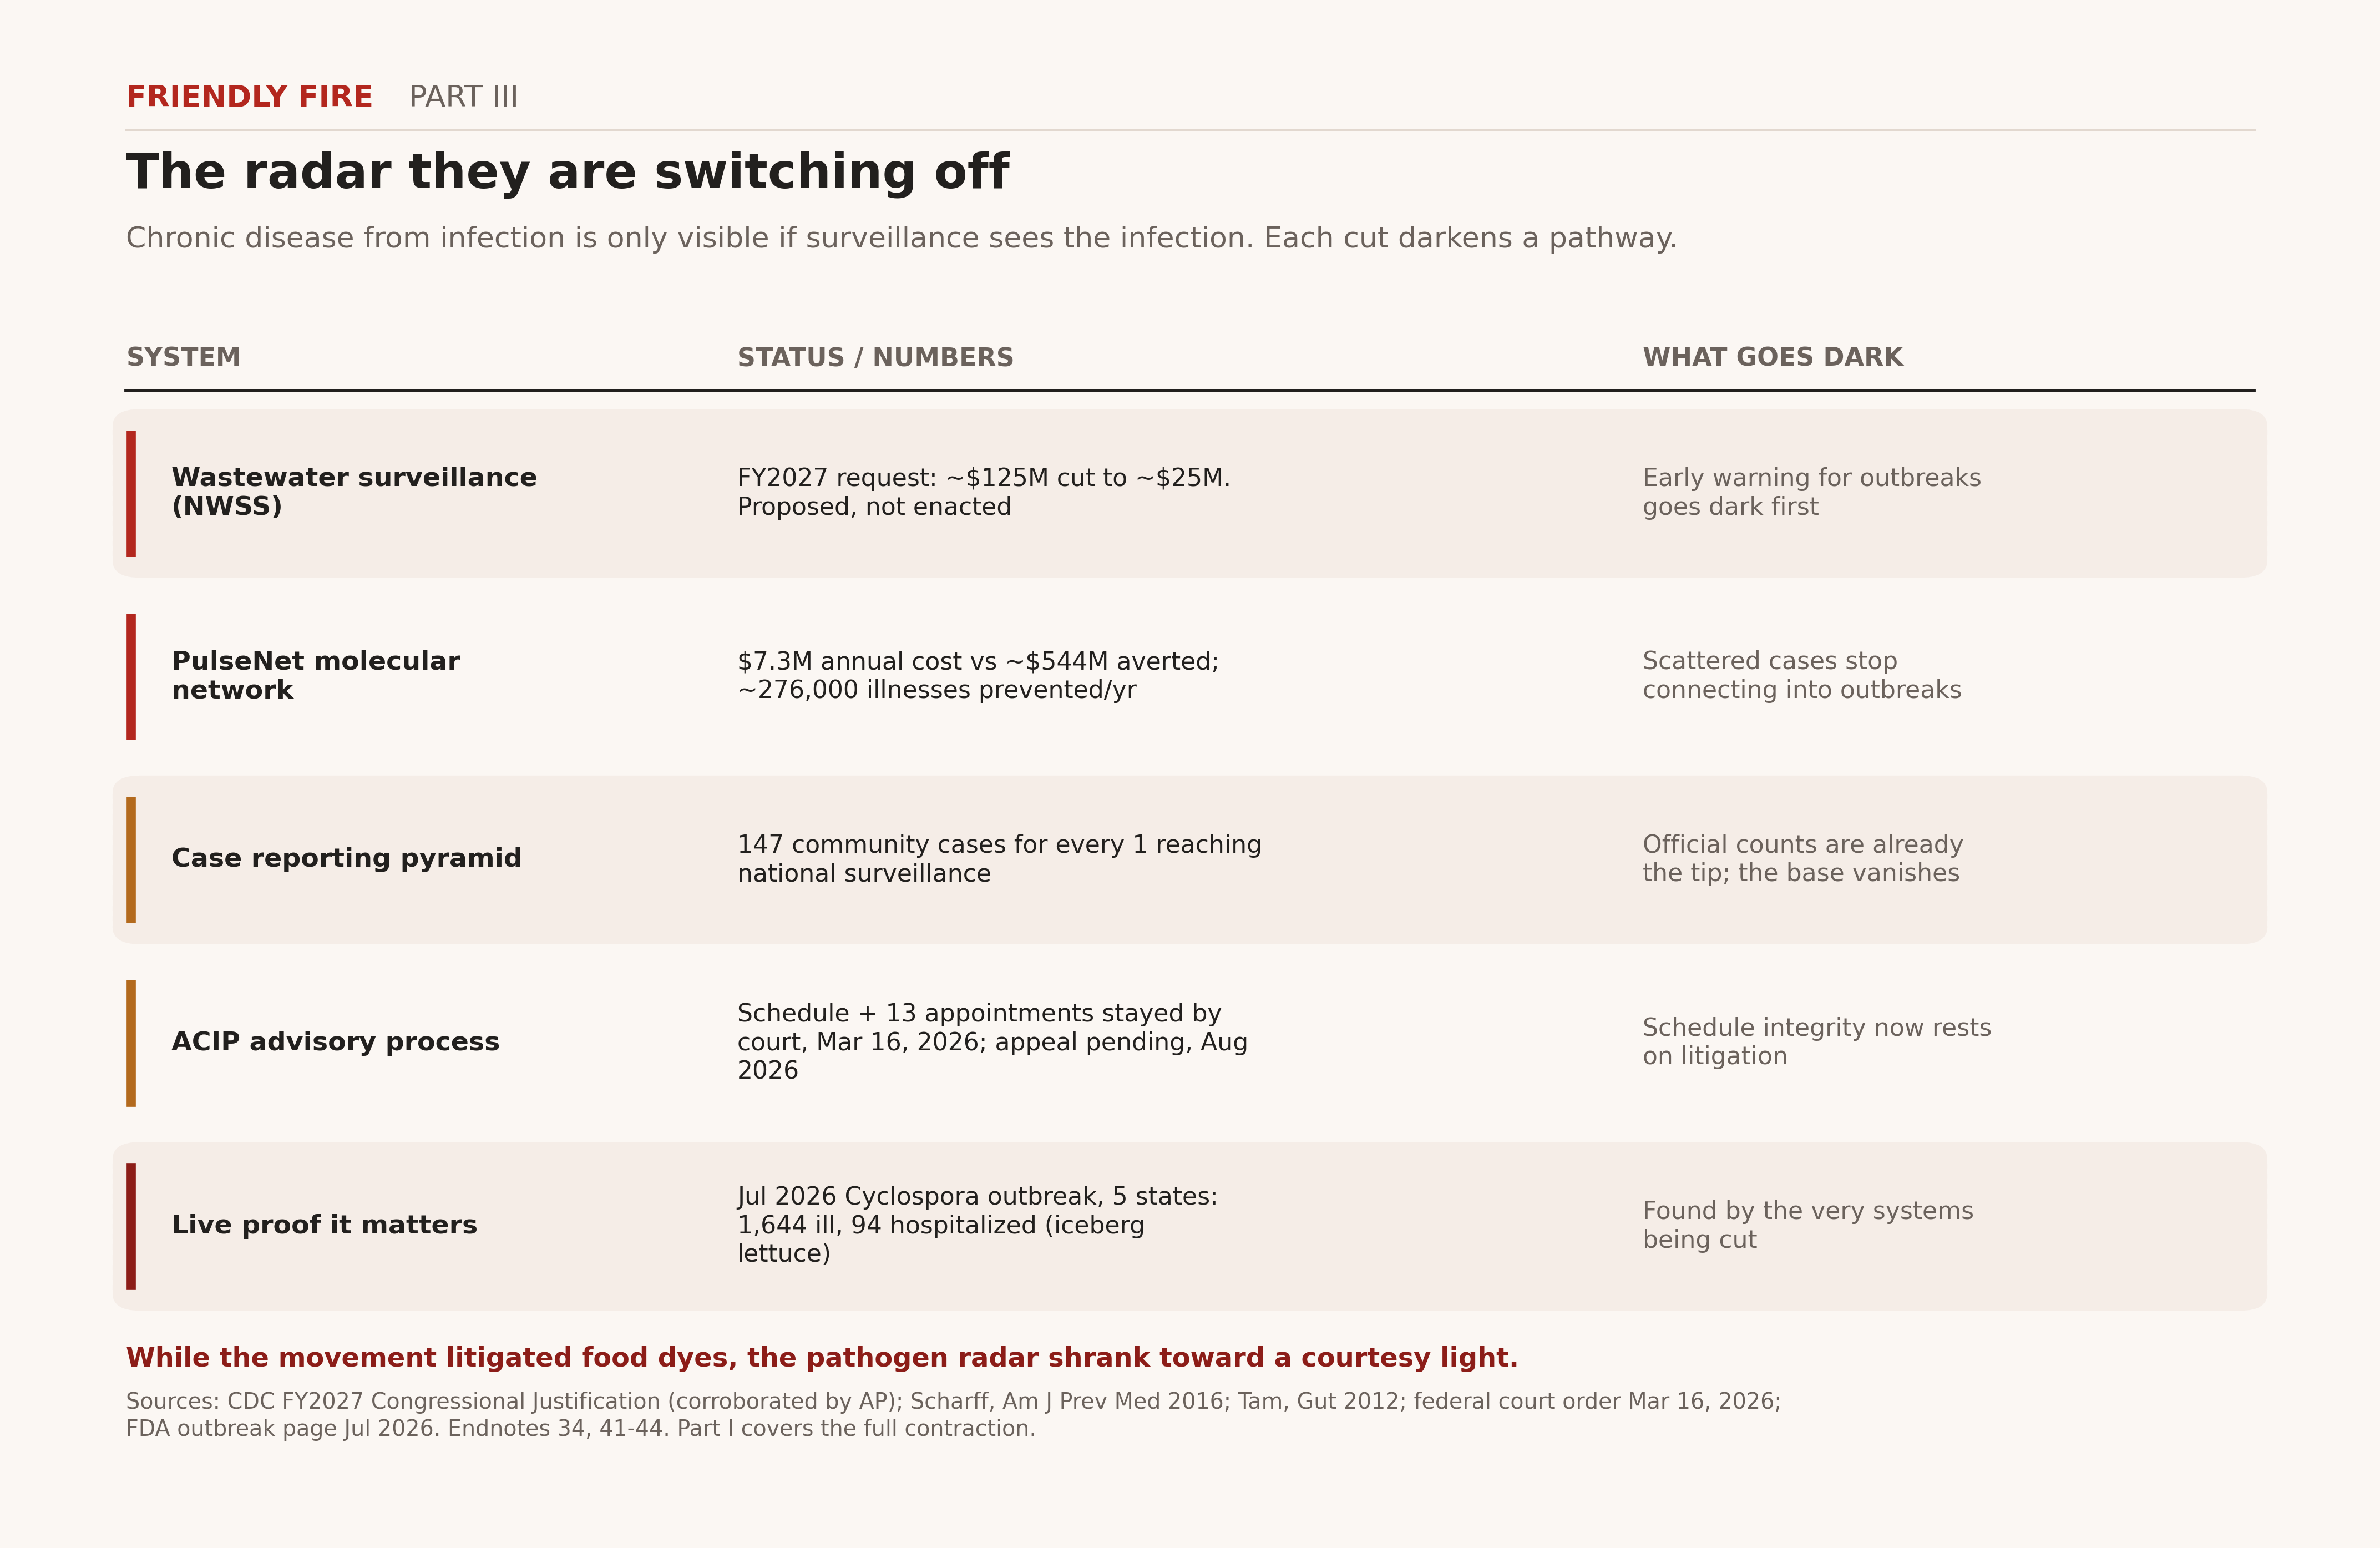
Figure 7. The surveillance systems being cut, and what each cut darkens.
What they reached for instead
Against this causal inventory, weigh what the movement elevated.
Acetaminophen and autism. The September 2025 announcement leaned on associational studies while a Swedish national cohort of 2.48 million children sat in JAMA answering the question. In sibling-controlled analyses, the hazard ratios collapse to null: 0.98 for autism, 0.98 for ADHD, 1.01 for intellectual disability. The unadjusted elevations of 5 to 7% were familial confounding, not causation [45]. The design that controls for the family is the design that kills the claim.
The citations. The MAHA Report cited studies that do not exist. At least seven of its sources could not be located; epidemiologist Katherine Keyes said of a paper attributed to her that it “is not a real paper that I or my colleagues were involved with.” The White House called it a formatting problem and swapped the citations within hours [46]. A movement that fabricates its evidence base while demanding gold-standard science from everyone else has told you what it is.
Seed oils. The trial and cohort evidence runs opposite to the poison narrative: substituting polyunsaturated vegetable oils for saturated fat cut coronary events 19% in pooled randomized trials, and higher linoleic acid intake tracks with 15% fewer coronary events across 310,000 people in cohorts. One reanalyzed 1960s trial complicates the picture and is duly cited; the weight of evidence does not move [47].
The autism epidemic. Diagnostic criteria broadened, screening intensified, and children were reclassified between categories. Denmark attributes about 60% of its recorded increase to reporting changes alone; California attributes about a quarter of caseload growth to diagnostic substitution; Sweden finds the autism symptom phenotype flat across a decade while diagnoses climbed [48]. How much residual true increase remains is a real and open question. A movement serious about it would fund the ascertainment-controlled studies, not the press conferences.
Thimerosal. Removed from routine childhood vaccines by 2001. Autism prevalence kept rising, which is the cleanest natural-experiment refutation a hypothesis can receive [49]. The goalposts moved anyway: to aluminum, to schedule density, to acetaminophen. A hypothesis that survives its own disconfirmation is not a hypothesis. It is an identity.
The pattern across all four is one reasoning architecture: post hoc correlation elevated over trial evidence, dose ignored, detection bias unexamined, and every null result absorbed as proof of conspiracy. Part II catalogued the full taxonomy. Here it is sufficient to note that the same movement applying that architecture to dyes and oils declined to apply the far stronger causal evidence sitting in the infection column.
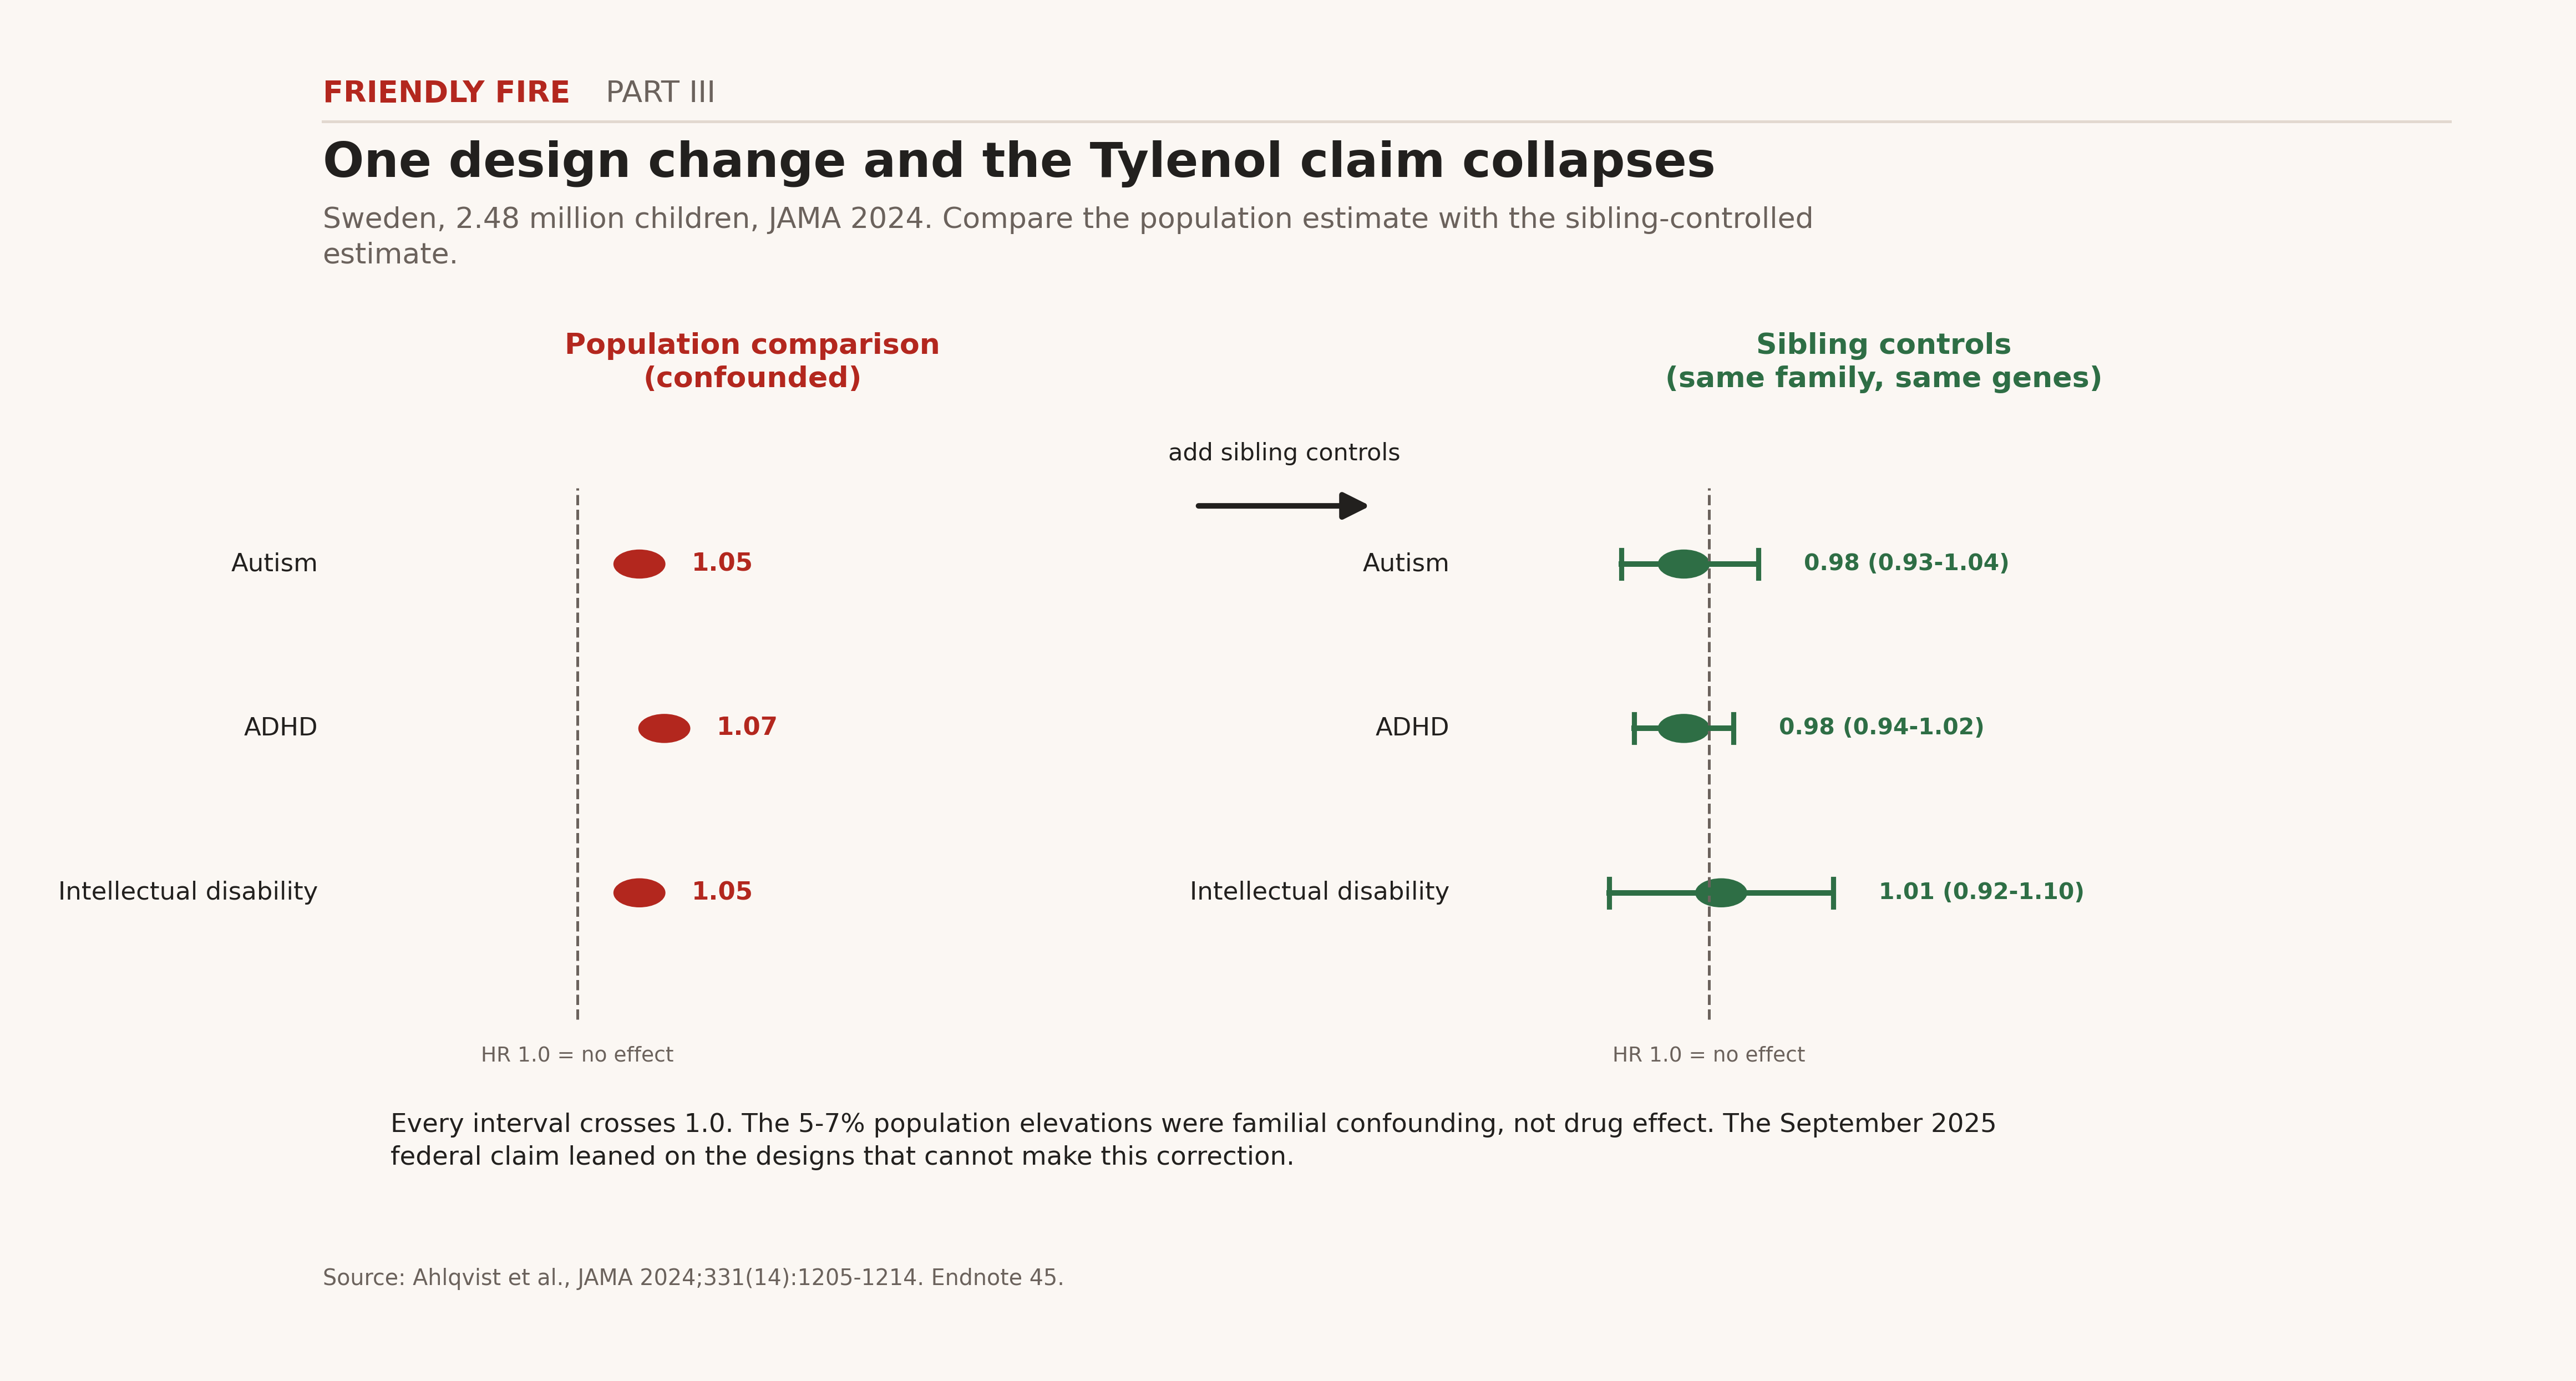
Figure 8. Acetaminophen and neurodevelopment: population versus sibling-controlled estimates (JAMA 2024).
What infection prevention already bought, and what neglect is buying back
The 1964 to 1965 rubella epidemic gave America 12.5 million infections, 11,000 pregnancy losses, 2,100 newborn deaths, and 20,000 children born with congenital rubella syndrome: deafness, blindness, heart defects, intellectual disability. Vaccination ended it; the US declared rubella eliminated in 2004 [50]. That is a chronic disease prevention triumph on the scale the movement claims to want, and vaccines did it.
The unfinished ledger is growing. Congenital CMV touches 1 in 200 American newborns, the leading nongenetic cause of permanent childhood hearing loss, with no vaccine yet [51]. Congenital syphilis, fully preventable with a $15 test and penicillin, hit 3,761 cases in 2022, including 231 stillbirths and 51 infant deaths, more than ten times the 2012 count, with missed testing and treatment opportunities in 88% of cases [52]. Zika wrote its own chapter in microcephaly [53]. Every one of these is a lifetime of chronic disability loaded at birth, and every one is an infection.
The ledger nobody keeps
Run the sequelae ledger the way an epidemiologist would, and chronic disease keeps resolving into infection’s afterlife. Severe sepsis triples the odds of lasting moderate to severe cognitive impairment in survivors [54]. Laboratory-confirmed influenza multiplies acute MI risk sixfold in the following week, which makes a flu shot cardiology [55]. One in five bacterial meningitis survivors carries permanent sequelae [56]. Untreated chlamydia ascends to pelvic inflammatory disease, scarred tubes, infertility, ectopic pregnancy [57]. An estimated 280,000 Americans carry Trypanosoma cruzi; 20 to 30% of chronic infections progress to cardiac or GI disease [58]. Roughly half of cured pulmonary tuberculosis patients keep impaired lungs [59]. Polio’s survivors met it again decades later as post-polio syndrome [60]. Measles seeds SSPE, universally fatal, at 7 to 11 per 100,000 cases overall and as high as 1 in 609 when infants are infected [61]. Most survivors of West Nile encephalitis in the Houston cohort never regained normal neurological exams [62]. And antimicrobial resistance, the quiet multiplier under all of it, already claims more than 35,000 American lives a year [63].
None of this is exotic. It is the ordinary arithmetic of infection and time. A chronic disease movement that does not carry this ledger is not doing epidemiology. It is doing branding.
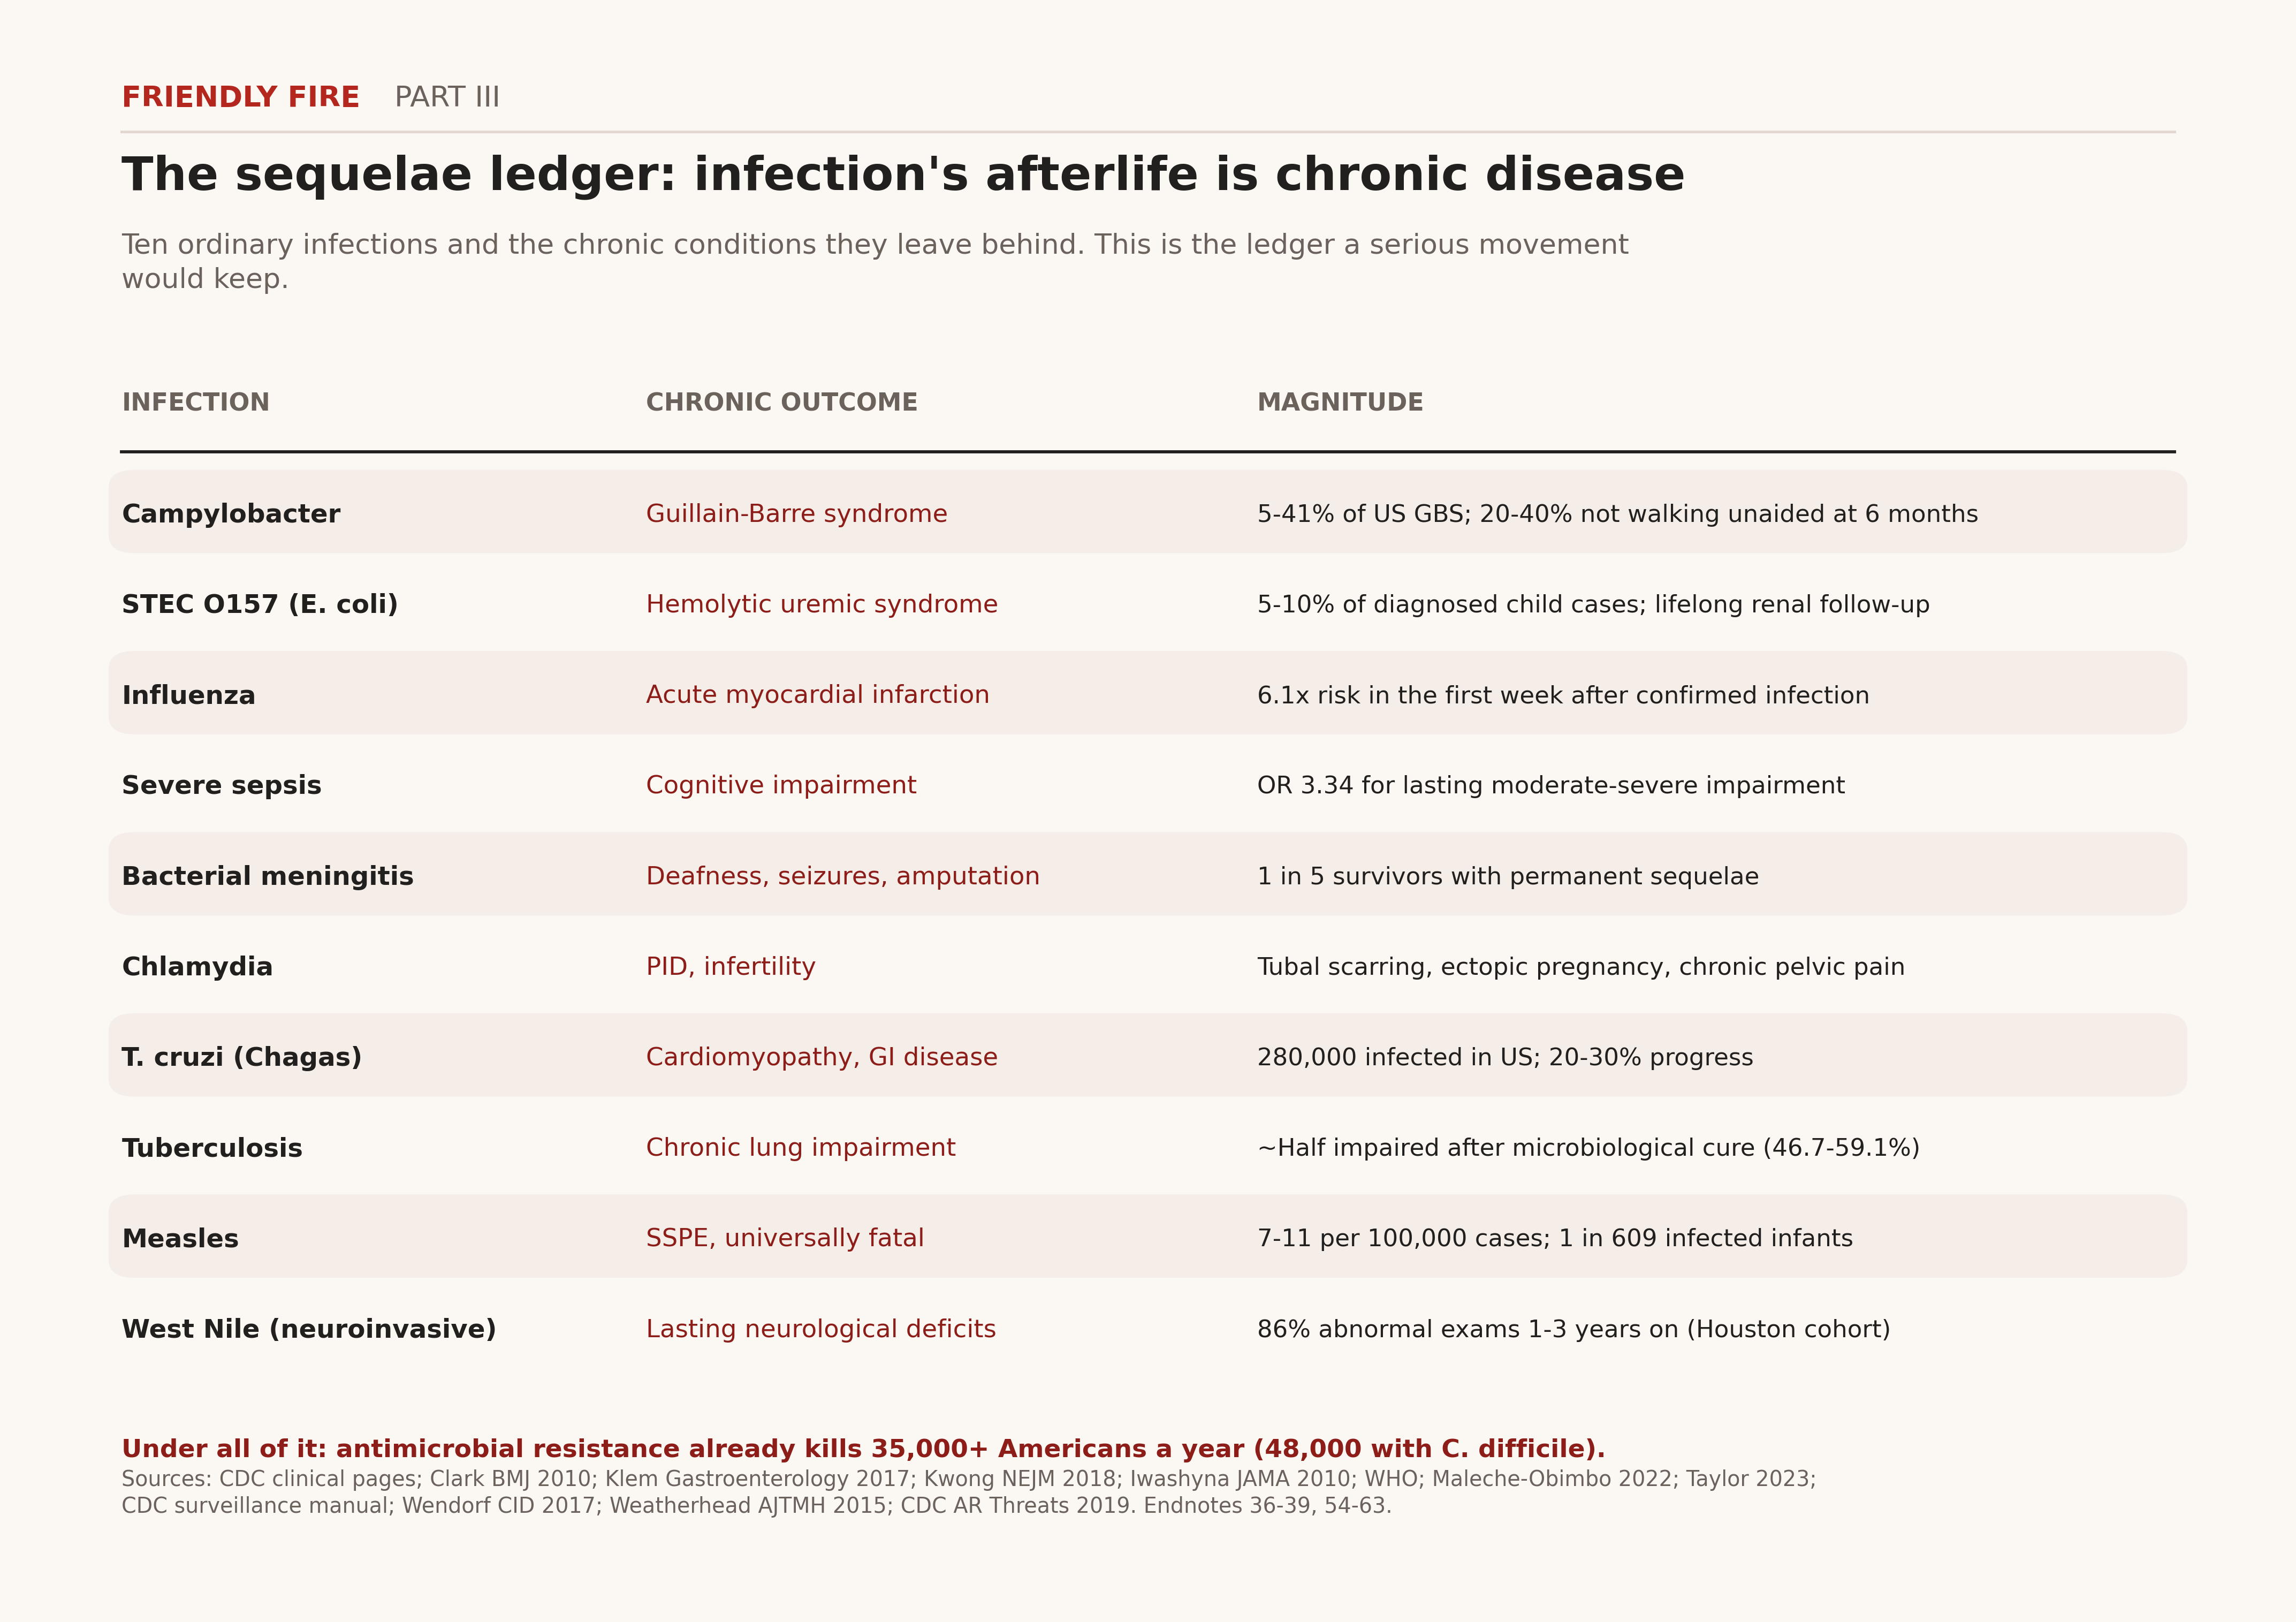
Figure 9. The sequelae ledger: chronic outcomes that follow common infections.
Red Team: The Wrong Enemy
“You are attacking a straw man; nobody claims infections do not cause disease.” Fair, and the honest version of the criticism is that the movement does not deny infectious etiology so much as it never mentions it. That is the charge: not denial, omission. A chronic disease agenda that discusses seed oils and food dyes at length while never mentioning that a bacterium causes 89 percent of non-cardia gastric cancer has not made an error of fact. It has made an error of proportion, and the proportion is where the preventable deaths live.
“Fewer than 5 percent of US cancers are infection-attributable, so this is a rounding error.” The strongest numerical objection, and I conceded it in the opening section before making the argument. Two responses. First, 5 percent of American cancer incidence is still tens of thousands of cases a year, and they are concentrated in cancers we know how to prevent outright. Second, the actionability differential is the entire argument: we have a vaccine for one cause and a ten-day antibiotic course for another, against a cardiometabolic burden where the best interventions are behavioral, partial, and hard to sustain at population scale. Prevention should be allocated by tractability, not only by size.
“You are cherry-picking the strongest studies.” The section on the widening frontier exists precisely to refute this. I gave you the failed EBV trial, the confidence interval that spans sixty-fold, the healthy-vaccinee bias that probably inflates the dementia finding, the reverse causation in the enterovirus data, the contested measles mortality coupling, the disputed Fusobacterium taxonomy, and the fact that HPV coverage is stable rather than falling. If I were cherry-picking, that paragraph would not exist.
“Cataloguing fallacies does not make their conclusions false.” Correct, and it is the sharpest objection to the section on what they reached for instead, so it gets a direct answer. An argument can be badly reasoned and still land on a true conclusion by luck. That is precisely why that section does not stop at naming the moves: the acetaminophen claim is answered with the sibling-control study that breaks it, the thimerosal hypothesis is answered by what happened to prevalence after 2001, and the seed oil claim is answered by trial evidence pointing the other way. The fallacies explain why the method keeps producing wrong answers; the evidence is what shows the answers are wrong. If someone in that movement produces a well-designed study demonstrating harm I have dismissed, I will say so in this publication, under my own name.
“You are psychoanalyzing a movement instead of engaging its strongest case.” A fair worry, which is why the opening section concedes the strongest case in full before anything else, and why the same standard applies to this movement's critics. The reverse genetic fallacy, false because Kennedy said it, is as invalid as anything I catalogue.
“The sequelae catalogue is a parade of rare outcomes with the denominators left out.” A fair criticism of the presentation, so here are the denominators. Guillain-Barre follows Campylobacter infection at roughly 0.2 to 1.7 per 1,000 infections. Subacute sclerosing panencephalitis follows roughly 7 to 11 per 100,000 measles cases, and as high as 1 in 609 when infants are infected. Hemolytic uremic syndrome follows five to ten percent of diagnosed O157 infections, which is the outlier on this list rather than the norm. For any individual reader, the per-infection probability of these outcomes is low, and I should say so plainly rather than let a list of frightening words imply otherwise. The argument is about population arithmetic, not personal risk: Campylobacter alone causes well over a million American illnesses a year, and one in a thousand of a very large number is a great many people who cannot walk unaided six months later. Both things are true, and an honest piece states both.
“Sepsis survivors were sick before the sepsis; you are attributing pre-existing frailty to infection.” The strongest methodological objection to the whole sequelae section, and it applies in principle to nearly every entry. The specific answer for sepsis is that the study measured cognitive and functional status in the same individuals before hospitalization and after, so each patient serves as his own comparison rather than being compared to healthier strangers [54]. That design addresses this exact charge, though it does not eliminate residual confounding, and I would not claim it does. For the weaker entries on the list, the objection has more purchase, which is why the figures are presented with their designs attached rather than as a flat list of causes.
“Walkerton is one town.” Correct, and I have leaned on it heavily because events like it are rare and the follow-up was unusually good: a defined exposure, a defined cohort, and eight years of tracking [36]. What it establishes is that a severe waterborne exposure can produce measurable cardiorenal disease years later. What it does not establish is that every episode of gastroenteritis carries that risk, and anyone citing Walkerton for the general case, including me, should be held to that boundary.
“Congenital syphilis is a treatment failure, not a surveillance failure. Your own source says testing and treatment gaps drove 88 percent of cases.” This is the sharpest objection in the piece and it is correct on the facts, so I will concede it precisely. Detection and response are different functions, and the syphilis catastrophe indicts response: the cases were largely detectable, and the system failed to test and treat women who were already in contact with care [52]. I am not using syphilis to argue that better detection would have prevented those 231 stillbirths. I am using it for the narrower claim it does support, which is the refutation of the diseases-of-the-past plank: a disease near elimination in 2000 returned more than tenfold within a decade of slackened execution. Pathogens do not retire. That is the lesson, and it is a lesson about sustained capacity rather than detection alone.
What a serious agenda would do
A chronic disease movement that followed its own evidence standard would do five things now. Restore the lawful advisory process and the stayed schedule permanently, because credibility in immunization policy is itself a public health asset. Hold HPV dosing to the evidence-graded process and drive catch-up coverage, because a 27% national decline in young women's cervical cancer is a return few chronic disease programs can show. Fund the radar: wastewater surveillance, PulseNet, and the case reporting that turns 147 hidden cases into one visible signal. Accelerate the EBV, CMV, and coxsackievirus vaccine programs, because MS, congenital hearing loss, and possibly type 1 diabetes are on the table. And keep measles eliminated, because immune amnesia means every outbreak taxes children’s defenses against everything else.
The movement will do none of it while defending vaccines remains unsayable inside its coalition. That is the diagnosis this series has been building toward. Part I showed the surveillance being switched off. Part I showed the surveillance being switched off. Part II showed the medicine cabinet outsourced. Part III shows the cost: the one cause of chronic disease with receipts, waved off to protect a narrative.
In combat, friendly fire is a tragedy of confusion. In public health, it is now a policy choice. The chronic disease crisis is real. The best-evidenced cause is sitting in plain sight, with the trials done, the mechanisms mapped, and the vaccines either in hand or in phase 2. A movement that will not touch it has told you its priority, and it is not your health.
Andrew G. Huff, PhD, MS, is an epidemiologist and national security scientist, a US Army infantry veteran of OIF and OEF, former Q-cleared scientist, and founder of Risk Factor Research, LLC. He writes at @aghuff.
Funding: none. The author declares the affiliations above and no competing financial interest in any vaccine, diagnostic, or surveillance vendor named or implied. Views are the author’s alone. Research verification and document production were AI-assisted under the author’s direction; all claims and citations were verified against primary sources on August 19, 2026.
Endnotes
1. CDC, About Chronic Diseases (page last reviewed May 14, 2026): 3 in 4 US adults have at least one chronic condition and more than half have two or more; the page cites the BRFSS 2013-2023 analysis in reference 2 (https://www.cdc.gov/chronic-disease/about/index.html).
2. Watson KB et al. Trends in Multiple Chronic Conditions Among US Adults, by Life Stage, Behavioral Risk Factor Surveillance System, 2013-2023. Prev Chronic Dis 2025;22:240539 (https://www.cdc.gov/pcd/issues/2025/24_0539.htm): 76.4% of adults (about 194 million) reported at least one chronic condition in 2023; high cholesterol 35.3%, hypertension 34.5%, obesity 32.7%, diabetes 12.1%; among adults 18-34, obesity rose from 22.1% to 27.3% and depression from 16.4% to 25.0% across 2013-2023.
3. NCHS, Mortality in the United States, 2024. Data Brief 548, January 2026 (https://www.cdc.gov/nchs/products/databriefs/db548.htm): life expectancy 79.0 years, an all-time high (NCHS release: https://www.cdc.gov/nchs/pressroom/releases/20260129.html); age-adjusted death rate down 3.8%, from 750.5 to 722.1 per 100,000. Leading causes, 2024: heart disease 683,491; cancer 619,876 (https://www.cdc.gov/nchs/fastats/leading-causes-of-death.htm).
4. Plummer M et al. Global burden of cancers attributable to infections in 2012: a synthetic analysis. Lancet Glob Health 2016;4(9):e609-e616 (https://pubmed.ncbi.nlm.nih.gov/27470177/): attributable fractions range from under 5% in the USA, Canada, Australia, New Zealand, and some countries of western and northern Europe to more than 50% in some sub-Saharan African countries. IARC’s World Cancer Report 2020 reaffirms the pattern with 2018 data: under 5% in many high-income countries and at least one third in sub-Saharan Africa.
5. IARC World Cancer Report 2020, section 2.2, Infectious agents (Newton R, de Martel C, Plummer M) (https://www.ncbi.nlm.nih.gov/books/NBK606494/): eleven Group 1 infectious carcinogens; one bacterium, seven viruses, three macroparasites.
6. de Martel C et al. Global burden of cancer attributable to infections in 2018: a worldwide incidence analysis. Lancet Glob Health 2020;8(2):e180-e190 (https://www.thelancet.com/journals/langlo/article/PIIS2214-109X(19)30488-7/fulltext): 2.2 million infection-attributable cases of roughly 18 million total, which IARC describes as about one eighth of all new cases; H. pylori 810,000, including 89% of non-cardia gastric cancer; HPV 690,000; HBV 360,000; HCV 160,000. The frequently cited 13% derives from this 2018 analysis, not from Plummer 2016, which reported 15.4% for 2012.
7. Choi IJ et al. Family history of gastric cancer and Helicobacter pylori treatment. N Engl J Med 2020;382(5):427-436 (https://www.nejm.org/doi/full/10.1056/NEJMoa1909666): 1,676 in the modified intention-to-treat analysis; median follow-up 9.2 years; gastric cancer 1.2% with eradication vs 2.7% with placebo; HR 0.45 (95% CI 0.21-0.94).
8. Ford AC, Yuan Y, Moayyedi P. Helicobacter pylori eradication therapy to prevent gastric cancer: systematic review and meta-analysis. Gut 2020;69(12):2113-2121 (https://pubmed.ncbi.nlm.nih.gov/32205420/): RR 0.54 (95% CI 0.40-0.72) for gastric cancer incidence in healthy individuals; NNT 72. The companion Cochrane review (Ford AC et al. Cochrane Database Syst Rev 2020;CD005583.pub3; https://pubmed.ncbi.nlm.nih.gov/32628791/) grades the evidence as moderate certainty in healthy asymptomatic infected Asian individuals and cautions that it cannot necessarily be extrapolated to other populations.
9. Walboomers JMM et al. Human papillomavirus is a necessary cause of invasive cervical cancer worldwide. J Pathol 1999;189(1):12-19 (https://pubmed.ncbi.nlm.nih.gov/10451482/): HPV DNA in 99.7% of adequate specimens from an IARC-coordinated survey of about 1,000 cervical cancers from 22 countries. IARC’s attributable fraction for cervical cancer is 100%; the two figures are not interchangeable.
10. Falcaro M et al. The effects of the national HPV vaccination programme in England, UK, on cervical cancer and grade 3 cervical intraepithelial neoplasia incidence: a register-based observational study. Lancet 2021;398(10316):2084-2092 (https://www.thelancet.com/journals/lancet/article/PIIS0140-6736(21)02178-4/abstract): relative reductions in cervical cancer of 87% (95% CI 72-94) with vaccine offered at 12-13, 62% (52-71) at 14-16, and 34% (25-41) at 16-18; corresponding CIN3 reductions 97%, 75%, and 39%; an estimated 448 (339-556) fewer cervical cancers and 17,235 (15,919-18,552) fewer CIN3 cases by June 30, 2019.
11. Lei J et al. HPV vaccination and the risk of invasive cervical cancer. N Engl J Med 2020;383(14):1340-1348 (https://www.nejm.org/doi/full/10.1056/NEJMoa1917338): Swedish cohort of 1,672,983 girls and women aged 10-30 followed 2006-2017; fully adjusted incidence rate ratio 0.37 (95% CI 0.21-0.57), and 0.12 (0.00-0.34) for vaccination before age 17 versus 0.47 (0.27-0.75) at ages 17-30.
12. Jiang C et al. State-level progress in reducing cervical cancer incidence among US young women between the pre- and post-human papillomavirus vaccination eras. J Natl Cancer Inst 2026;118(8):1395-1402, published online February 24, 2026 (https://academic.oup.com/jnci/article-abstract/118/8/1395/8495022); American Cancer Society press release, February 23, 2026 (https://pressroom.cancer.org/declines-in-cervical-cancer-hpv-vaccine): cervical cancer incidence at ages 20-31 fell 27% (RR 0.73, 95% CI 0.70-0.75), from 5.1 to 3.7 per 100,000, comparing 2016-2021 with 2000-2005 across 47 states and DC; each 10% increase in state HPV vaccination coverage was associated with an 11.5% (95% CI 5.4-17.2) greater reduction in the state rate ratio, adjusted for screening; state variation ran from reductions above 50% (DC, Rhode Island, Michigan, Hawaii) to no progress (Vermont, West Virginia, Idaho, Arkansas, Alabama).
13. Van Dyne EA et al. Trends in human papillomavirus-associated cancers, United States, 1999-2015. MMWR 2018;67(33):918-924 (https://www.cdc.gov/mmwr/volumes/67/wr/mm6733a2.htm; https://www.ncbi.nlm.nih.gov/pmc/articles/PMC6107321/): oropharyngeal squamous cell carcinoma rose 2.7% per year in men and 0.8% per year in women while cervical carcinoma fell 1.6% per year; by 2015 oropharyngeal SCC (18,917 cases; 15,479 in men, 3,438 in women) had surpassed cervical carcinoma (11,788) as the most common HPV-associated cancer in the United States. Population-based screening is recommended for cervical cancer only; there is no recommended screening for oropharyngeal cancer. (These trend figures are often misattributed to Senkomago et al., MMWR 2019;68(33):724-728, which covers HPV-attributable cancers, 2012-2016.)
14. Bjornevik K et al. Longitudinal analysis reveals high prevalence of Epstein-Barr virus associated with multiple sclerosis. Science 2022;375(6578):296-301 (https://www.science.org/doi/10.1126/science.abj8222): more than 10 million US military personnel; 955 incident MS cases, 801 with adequate serum samples, matched to 1,566 controls; 35 EBV-negative at baseline, of whom 34 seroconverted before onset; HR 32.4 (95% CI 4.3-245.3); CMV, similarly transmitted, served as negative control and showed no association; serum neurofilament light rose only after seroconversion.
15. Lanz TV et al. Clonally expanded B cells in multiple sclerosis bind EBV EBNA1 and GlialCAM. Nature 2022;603(7900):321-327 (https://www.nature.com/articles/s41586-022-04432-7): high-affinity molecular mimicry between EBNA1 (residues 386-405) and the CNS protein GlialCAM; a cross-reactive antibody isolated from CSF B cells; EBNA1 immunization exacerbated disease in the EAE model; plasma reactivity to both antigens was significantly higher in MS patients (n=36) than healthy controls (n=20). The authors describe the mimicry as prevalent in a subset of MS patients rather than quantifying a fixed percentage.
16. Atara Biotherapeutics, EMBOLD phase 2 primary analysis, press release November 8, 2023 (https://investors.atarabio.com/news-events/press-releases/detail/330/atara-biotherapeutics-announces-primary-analysis-data-from): ATA188 missed its primary endpoint of confirmed disability improvement at 12 months in non-active progressive MS (103 participants in the primary analysis); 6% confirmed disability improvement with treatment against a 16% placebo response, the placebo figure well above the expected 4-6%.
17. Moderna EBV program, ClinicalTrials.gov: mRNA-1189, NCT05164094, phase 1/2, 867 enrolled, primary completion estimated October 5, 2026 (https://clinicaltrials.gov/study/NCT05164094); mRNA-1195, NCT05831111, phase 1, 482 enrolled, primary completion estimated October 7, 2026 (https://clinicaltrials.gov/study/NCT05831111); and NCT06735248, a phase 2 randomized, observer-blind, placebo-controlled dose-ranging trial of mRNA-1195 in 180 EBV-seropositive adults aged 18-55 with relapsing MS diagnosed within 24 months, started April 16, 2025, recruiting in the US, UK, and Australia, with estimated completion January 8, 2029 (https://clinicaltrials.gov/study/NCT06735248).
18. Safiri S et al. The Global Burden of Rheumatic Heart Disease, 1990-2021. Clinical Medicine 2026 (https://www.sciencedirect.com/science/article/pii/S1470211826000424): GBD 2021 estimates of approximately 54.8 million prevalent cases (54,785,119) and roughly 373,000 deaths (373,345) in 2021; age-standardised prevalence highest in Eritrea (1,865.4 per 100,000) and lowest in Finland (17.4 per 100,000), a more than hundredfold contrast. A parallel GBD 2021 analysis (Zou Y et al. JACC: Basic to Translational Science 2026;11(4):101511; https://www.jacc.org/doi/10.1016/j.jacbts.2026.101511) reports slightly rising age-standardised prevalence alongside falling mortality and DALY rates and projects rising incidence through 2050. GBD 2019 gave substantially different figures (40.5 million cases, about 306,000 deaths), so counts are not comparable across GBD rounds, and secondary summaries disagree on the direction of the mortality trend since 1990: the age-standardised death rate fell 56.2% from 1990 to 2021 while absolute counts did not fall commensurately.
19. Eyting M et al. A natural experiment on the effect of herpes zoster vaccination on dementia. Nature 2025;641:438-446 (https://www.nature.com/articles/s41586-025-08800-x): Welsh date-of-birth eligibility cutoff of September 2, 1933; uptake 0.01% versus 47.2% across one week; n=282,541; absolute risk reduction 3.5 percentage points (95% CI 0.6-7.1), relative reduction 20.0% (6.5-33.4), over seven years; effect stronger in women.
20. Rayens E, Sy LS, Qian L, et al. Recombinant zoster vaccine is associated with a reduced risk of dementia. Nat Commun 2026;17:2056 (https://www.nature.com/articles/s41467-026-69289-0): Kaiser Permanente Southern California matched cohort of 65,800 two-dose recombinant zoster vaccine recipients aged 65 and older against 263,200 matched unvaccinated members; 51% lower dementia risk (adjusted HR 0.49, 95% CI 0.46-0.51). The divergence from the quasi-randomized Welsh estimate is consistent with healthy-vaccinee bias; the authors’ own active-comparator analysis against Tdap attenuates the estimate to adjusted HR 0.73 (0.67-0.79).
21. Pomirchy M et al. Herpes zoster vaccination and incident dementia in Canada: an analysis of natural experiments. Lancet Neurol 2026;25(2):170-180 (https://www.thelancet.com/journals/laneur/article/PIIS1474-4422(25)00455-7/fulltext); Taquet M et al. The recombinant shingles vaccine is associated with lower risk of dementia. Nat Med 2024;30(10):2777-2781 (https://www.nature.com/articles/s41591-024-03201-5); Taquet M et al., lower dementia risk after AS01-adjuvanted vaccination against shingles and RSV, npj Vaccines 2025;10:130 (https://www.nature.com/articles/s41541-025-01172-3). No randomized trial has reported; NCT07485283, Recombinant Herpes Zoster Vaccine for Prevention of Cardiovascular Events and Dementia, is registered (https://clinicaltrials.gov/study/NCT07485283).
22. Isaacs SR et al. Enteroviruses and risk of islet autoimmunity or type 1 diabetes: systematic review and meta-analysis of controlled observational studies. Lancet Diabetes Endocrinol 2023 (https://www.thelancet.com/journals/landia/article/PIIS2213-8587(23)00122-5/abstract): 60 studies, 12,077 participants; OR 2.1 (95% CI 1.3-3.3) for islet autoimmunity, 8.0 (4.9-13.0) for type 1 diabetes, and 16.2 (8.6-30.5) within one month of diagnosis. The gradient toward diagnosis is the signature of reverse causation and detection bias.
23. Hyoty H et al. Safety, tolerability and immunogenicity of PRV-101, a polyvalent inactivated coxsackievirus B vaccine: the double-blind randomised placebo-controlled phase 1 PROVENT trial. Diabetologia 2024;67:811-821 (https://www.ncbi.nlm.nih.gov/pmc/articles/PMC10954874/): n=32; primary safety endpoint met with no serious adverse events; dose-dependent neutralizing responses against all five serotypes, protective titres in more than 90% of participants. No efficacy data against type 1 diabetes exist.
24. Rosas-Salazar C et al. Respiratory syncytial virus infection during infancy and asthma during childhood in the USA (INSPIRE): a population-based prospective birth cohort study. Lancet 2023;401(10389):1669-1680 (https://www.thelancet.com/journals/lancet/article/PIIS0140-6736(23)00811-5/abstract): adjusted RR 0.74 (95% CI 0.58-0.94) for 5-year current asthma among those not infected in infancy; an estimated 15% (95% CI 2.2-26.8) of 5-year current asthma preventable by avoiding infant RSV infection.
25. Zepeda-Rivera M et al. A distinct Fusobacterium nucleatum clade dominates the colorectal cancer niche. Nature 2024;628:424-432 (https://www.nature.com/articles/s41586-024-07182-w). The clade taxonomy is challenged by Sivertsen A et al., bioRxiv preprint posted March 24, 2025 (https://www.biorxiv.org/content/10.1101/2025.03.20.644344v1), since peer reviewed as mBio 2025;16(9):e00941-25 (https://journals.asm.org/doi/10.1128/mbio.00941-25), arguing that the “Fna C1” clade is a misclassification of the validly published species F. watanabei and that the candidate virulence operons occur in other Fusobacterium species.
26. Cai M, Xie Y, Topol EJ, Al-Aly Z. Three-year outcomes of post-acute sequelae of COVID-19. Nat Med 2024;30(6):1564-1573 (https://www.nature.com/articles/s41591-024-02987-8): 135,161 US veterans who survived 30 days after infection against 5,206,835 uninfected VA users, followed three years; the VA population is mostly older, White, and male and may not generalize to other populations.
27. Khatami A et al. Association of parvovirus B19 and myocarditis/dilated cardiomyopathy: systematic review and meta-analysis. Microb Pathog 2022;162:105207, online September 24, 2021 (https://www.sciencedirect.com/science/article/abs/pii/S0882401021004812): pooled B19 prevalence 23.7% (95% CI 18.7-29.5) in myocarditis and 34.1% (23.8-46.1) in dilated cardiomyopathy; the association was significant for myocarditis (OR 4.32, 1.83-10.18) but not dilated cardiomyopathy (OR 1.16, 0.71-1.92). Bock CT, Klingel K, Kandolf R. Human parvovirus B19-associated myocarditis. N Engl J Med 2010;362(13):1248-1249 (https://www.nejm.org/doi/full/10.1056/NEJMc0911362): in endomyocardial biopsies from 498 patients with myocarditis or chronic dilated cardiomyopathy against 91 noninflamed control hearts, B19 RNA replicative intermediates were detected in inflamed hearts carrying high viral loads, localized to intramyocardial vessel endothelium. Genome presence alone does not establish causation: Schenk T et al. detected B19 DNA in 67% of autopsy myocardium from subjects without myocarditis or dilated cardiomyopathy, at viral loads comparable to cases (J Clin Microbiol 2009;47:106-110; https://journals.asm.org/doi/10.1128/jcm.01672-08).
28. Mina MJ et al. Measles virus infection diminishes preexisting antibodies that offer protection from other pathogens. Science 2019;366(6465):599-606 (https://www.science.org/doi/10.1126/science.aay6485): 77 unvaccinated children sampled before and about two months after natural measles; elimination of 11-73% of the antibody repertoire across individuals; mean reduction in overall repertoire diversity approximately 20%; median loss of preexisting pathogen-specific repertoire 40% after severe and 33% after mild measles; 12 of 77 lost more than 40% of repertoire diversity. MMR vaccination (n=33) produced no comparable loss.
29. Petrova VN et al. Incomplete genetic reconstitution of B cell pools contributes to prolonged immunosuppression after measles. Sci Immunol 2019;4(41):eaay6125 (https://www.science.org/doi/10.1126/sciimmunol.aay6125).
30. Mina MJ et al. Long-term measles-induced immunomodulation increases overall childhood infectious disease mortality. Science 2015;348(6235):694-699 (https://www.science.org/doi/10.1126/science.aaa3662). The ecological design and the magnitude of the mortality coupling drew a published Technical Comment and Response: Thakkar N, McCarthy KA. Science 2019;365(6449):eaax5552 (https://www.science.org/doi/10.1126/science.aax5552), arguing possible confounding by the two-year periodicity of measles incidence; and Mina MJ, Grenfell BT, Metcalf CJE. Response. Science 2019;365(6449):eaax6498 (https://www.science.org/doi/10.1126/science.aax6498).
31. CDC, Measles Cases and Outbreaks, page updated August 14, 2026 (https://www.cdc.gov/measles/data-research/index.html): 2,566 confirmed US cases in 2026 as of August 13, 2026, of which 2,550 were reported by 47 jurisdictions and 16 among international visitors; 94% outbreak-associated (2,407 of 2,566), including 1,375 from outbreaks that began in 2025; the 2025 full-year total of 2,289 was the highest annual count since 1991. Kindergarten MMR coverage fell from 95.2% in 2019-2020 to 92.5% in 2024-2025, leaving roughly 286,000 kindergartners at risk.
32. PAHO, Update on the review of measles elimination status, March 2, 2026 (https://www.paho.org/en/news/2-3-2026-update-review-measles-elimination-status): the elimination status of the United States and Mexico will be reviewed at the November 2026 meeting of the Regional Verification Commission for the Elimination of Measles, Rubella, and Congenital Rubella Syndrome; the analysis period runs one year from outbreak onset (January 20, 2025 for the US; February 1, 2025 for Mexico); re-establishment of endemic transmission is defined as uninterrupted circulation of the same virus genotype and lineage for 12 months or more in a specific geographic area.
33. PAHO, PAHO calls for regional action as the Americas lose measles elimination status, November 10, 2025 (https://www.paho.org/en/news/10-11-2025-paho-calls-regional-action-americas-lose-measles-elimination-status): following the Regional Verification Commission’s meeting of November 4-7, 2025, endemic measles transmission was found re-established in Canada after at least 12 months of circulation; because endemic transmission in any one country ends regional standing, the Region of the Americas lost its verification as free of endemic measles transmission, while all other countries retained national elimination status. As of November 7, 2025 the region had recorded 12,596 confirmed cases and 28 deaths across ten countries.
34. Order of March 16, 2026, US District Court for the District of Massachusetts (Judge Brian E. Murphy), granting a preliminary injunction that stays the revised immunization schedule announced January 5, 2026, the appointments of thirteen ACIP members made between June 2025 and January 2026, and all votes cast by those members, on the ground that the reconstitution of ACIP likely violated the Federal Advisory Committee Act; federal schedules reverted to the pre-January 2026 versions (APHA: https://www.apha.org/news-and-media/news-releases/apha-news-releases/federal-judge-blocks-immunization-schedule-changes; CRS: https://www.congress.gov/crs-product/R48982). The January 5 schedule had moved HPV vaccination to a single dose based on an HHS internal assessment conducted under a presidential directive, without an ACIP recommendation (https://www.sgo.org/news/the-new-u-s-childhood-vaccine-schedule-a-key-change-for-hpv-immunization/). The government appealed to the First Circuit on April 29, 2026; as of August 2026 the appeal is pending and the stay remains in effect (https://publications.aap.org/aapnews/news/34981/Government-appeals-AAP-vaccine-lawsuit-ruling).
35. Pingali C, Tankey D, Elam-Evans LD, et al. Vaccination coverage among adolescents aged 13-17 years: National Immunization Survey-Teen, United States, 2024. MMWR 2025;74(30), August 14, 2025 (https://www.cdc.gov/mmwr/volumes/74/wr/mm7430a1.htm): 78.2% of adolescents had at least one HPV dose and 62.9% were up to date, similar to 2023 (76.8% and 61.4%); HPV coverage has been statistically flat since 2022. Claims that US HPV coverage is currently falling are not supported by this surveillance.
36. Clark WF et al. Long term risk for hypertension, renal impairment, and cardiovascular disease after gastroenteritis from drinking water contaminated with Escherichia coli O157:H7: a prospective cohort study. BMJ 2010;341:c6020 (https://www.bmj.com/content/341/bmj.c6020). Walkerton Health Study, eight years after the 2000 outbreak (1,977 adult participants; 1,067 with acute gastroenteritis): adjusted hazard ratios 1.33 (95% CI 1.14-1.54) for hypertension, 3.41 (1.51-7.71) for renal impairment (both indicators present), and 2.13 (1.03-4.43) for cardiovascular disease.
37. Klem F et al. Prevalence, risk, and outcomes of irritable bowel syndrome after infectious enteritis: a systematic review and meta-analysis. Gastroenterology 2017;152(5):1042-1054 (https://www.gastrojournal.org/article/S0016-5085(16)35553-9/fulltext): 45 studies, 21,421 individuals; pooled prevalence of post-infectious IBS 10.1% (95% CI 7.2-14.1) at 12 months or more after infectious enteritis; risk 4.2-fold that of unexposed individuals (95% CI 3.1-5.7).
38. CDC, Clinical Overview of Campylobacter (https://www.cdc.gov/campylobacter/hcp/clinical-overview/index.html): CDC estimates that 0.2-1.7 of every 1,000 Campylobacter illnesses leads to Guillain-Barre syndrome and that Campylobacter is responsible for 5-41% of US GBS cases. Disability and mortality: Leonhard SE et al. Diagnosis and management of Guillain-Barre syndrome in ten steps. Nat Rev Neurol 2019;15:671-683 (https://www.nature.com/articles/s41582-019-0250-9): 60-80% of patients are able to walk independently at six months, leaving 20-40% who are not; mortality is 3-10% even with the best available care.
39. CDC, hemolytic uremic syndrome after STEC infection (https://www.cdc.gov/ecoli/signs-symptoms/hus.html): HUS can cause kidney failure, permanent health problems, and death, and among people with diarrhea it is most common in children under 5; about 8 in 10 children with HUS have STEC infection. CDC estimates around 5-10% of diagnosed STEC O157 infections progress to HUS (CDC infographic CS267331-A: https://stacks.cdc.gov/view/cdc/43339/cdc_43339_DS1.pdf).
40. Havelaar AH et al. World Health Organization global estimates and regional comparisons of the burden of foodborne disease in 2010. PLoS Med 2015;12(12):e1001923 (https://journals.plos.org/plosmedicine/article?id=10.1371/journal.pmed.1001923): 31 foodborne hazards caused 600 million (95% UI 420-960 million) illnesses, 420,000 deaths (310,000-600,000), and 33 million DALYs (25-46 million) in 2010, with post-infectious sequelae such as HUS and GBS included in the burden estimates. WHO Foodborne Disease Burden Epidemiology Reference Group.
41. Tam CC et al. Longitudinal study of infectious intestinal disease in the UK (IID2 study): incidence in the community and presenting to general practice. Gut 2012;61(1):69-77 (https://gut.bmj.com/content/61/1/69): 147 community cases and 10 general practice consultations for every case reported to national surveillance; community incidence 274 per 1,000 person-years.
42. Scharff RL et al. An economic evaluation of PulseNet: a network for foodborne disease surveillance. Am J Prev Med 2016;50(5 Suppl 1):S66-S73 (https://www.ajpmonline.org/article/S0749-3797(15)00610-8/fulltext): conservatively, 266,522 Salmonella, 9,489 E. coli, and 56 Listeria illnesses averted annually through industry process changes, reducing medical and productivity costs by $507 million; improved recalls avert a further 16,994 Salmonella and 2,819 E. coli illnesses and $37 million; annual public health agency costs are $7.3 million. CDC-coauthored economic evaluation.
43. FDA, Investigation of 5-State Outbreak of Cyclospora Illnesses: Iceberg Lettuce (July 2026) (https://www.fda.gov/food/outbreaks-foodborne-illness/investigation-5-state-outbreak-cyclospora-illnesses-iceberg-lettuce-july-2026): FDA-CDC investigation of Cyclospora illnesses linked to shredded iceberg lettuce from Taylor Farms de Mexico served at Taco Bell locations in Indiana, Kentucky, Michigan, Ohio, and West Virginia; as of July 17, 2026, 1,644 illnesses and 94 hospitalizations, no deaths, with onsets May 13 to July 13, 2026, and a voluntary market withdrawal and recall initiated July 17, 2026.
44. CDC FY2027 Congressional Justification (https://www.cdc.gov/budget/documents/fy2027/fy-2027-cdc-cj.pdf): National Wastewater Surveillance System national funding runs through September 30, 2026, with the FY2027 request reducing the program from roughly $125 million to roughly $25 million annually; figures corroborated in AP reporting (https://www.kunc.org/news/2026-01-18/cdc-studies-show-value-of-nationwide-wastewater-disease-surveillance-as-potential-funding-cut-looms). Proposed, not enacted; the distinction is maintained in the text. See Part I of this series for the full surveillance contraction record.
45. Ahlqvist VH, Sjoqvist H, Dalman C, et al. Acetaminophen use during pregnancy and children’s risk of autism, ADHD, and intellectual disability. JAMA 2024;331(14):1205-1214 (https://pubmed.ncbi.nlm.nih.gov/38592388/): Swedish nationwide cohort of 2,480,797 children born 1995-2019, followed through December 31, 2021. In sibling control analyses, hazard ratios were 0.98 (95% CI 0.93-1.04) for autism, 0.98 (0.94-1.02) for ADHD, and 1.01 (0.92-1.10) for intellectual disability. Models without sibling controls showed marginally elevated risks (HR 1.05, 1.07, and 1.05 respectively), indicating familial confounding rather than causation.
46. NOTUS, The MAHA Report Cites Studies That Don’t Exist, May 2025 (https://www.notus.org/health-science/make-america-healthy-again-report-citation-errors), and The MAHA Report Has Been Updated to Replace Citations That Didn’t Exist (https://www.notus.org/health-science/maha-report-update-citations): at least seven cited sources could not be located; epidemiologist Katherine Keyes stated that a paper attributed to her “is not a real paper that I or my colleagues were involved with.” The White House characterized the problem as formatting issues; the citations were replaced within hours. Corroborated by Science (https://www.science.org/content/article/trump-officials-downplay-fake-citations-high-profile-report-children-s-health) and CIDRAP (https://www.cidrap.umn.edu/public-health/maha-report-chronic-disease-us-kids-includes-fake-citations-other-errors).
47. On seed oils and cardiovascular outcomes, the randomized and prospective cohort evidence for replacing saturated fat with polyunsaturated vegetable oils runs opposite to the “seed oils are poison” claim. Mozaffarian D, Micha R, Wallace S. Effects on coronary heart disease of increasing polyunsaturated fat in place of saturated fat: a systematic review and meta-analysis of randomized controlled trials. PLoS Med 2010;7(3):e1000252 (https://journals.plos.org/plosmedicine/article?id=10.1371/journal.pmed.1000252): 8 trials, 13,614 participants, 1,042 CHD events; substitution reduced CHD events 19% (RR 0.81, 95% CI 0.70-0.95), about 10% per 5% of energy substituted. Farvid MS et al. Dietary linoleic acid and risk of coronary heart disease: a systematic review and meta-analysis of prospective cohort studies. Circulation 2014;130(18):1568-1578 (https://pubmed.ncbi.nlm.nih.gov/25161045/): 13 cohorts, 310,602 individuals; highest vs lowest linoleic acid intake associated with 15% lower CHD event risk (RR 0.85, 0.78-0.92) and 21% lower CHD death risk (RR 0.79). Sacks FM et al. Dietary fats and cardiovascular disease: a presidential advisory from the American Heart Association. Circulation 2017;136(3):e1-e23 (https://www.ahajournals.org/doi/abs/10.1161/cir.0000000000000510): core trials replacing saturated fat with polyunsaturated vegetable oil lowered cardiovascular disease approximately 30%. A reanalysis of the Minnesota Coronary Experiment (Ramsden CE et al. BMJ 2016;353:i1246; https://pubmed.ncbi.nlm.nih.gov/27071971/) found cholesterol lowering without a mortality benefit in that trial, but the weight of randomized and cohort evidence favors polyunsaturated vegetable oils over saturated fat for coronary risk.
48. On autism prevalence and ascertainment: successive diagnostic revisions broadened criteria, screening and service-linked incentives intensified, and diagnostic substitution shifted children between categories. Hansen SN, Schendel DE, Parner ET. Explaining the increase in the prevalence of autism spectrum disorders: the proportion attributable to changes in reporting practices. JAMA Pediatr 2015;169(1):56-62 (https://pubmed.ncbi.nlm.nih.gov/25365033/): Danish cohort of 677,915 children born 1980-1991; about 60% of the increase in recorded prevalence was attributable to the 1994 diagnostic criteria change and subsequent reporting changes. King M, Bearman P. Diagnostic change and the increased prevalence of autism. Int J Epidemiol 2009;38(5):1224-1234 (https://pubmed.ncbi.nlm.nih.gov/19737791/): diagnostic practice changes, including reclassification from mental retardation, accounted for roughly one quarter (26.4%) of California caseload growth, 1992-2005. Lundstrom S et al. Autism phenotype versus registered diagnosis in Swedish children: prevalence trends over 10 years in general population samples. BMJ 2015;350:h1961 (https://pubmed.ncbi.nlm.nih.gov/25922345/): the autism symptom phenotype remained stable in repeated population samples while registered diagnoses rose substantially. The text’s claim is deliberately limited to the direction of the bias and the acknowledged uncertainty about the residual true-increase fraction.
49. Thimerosal was removed from, or reduced to trace amounts in, all vaccines routinely recommended for young children in the United States by 2001 (excepting some multi-dose influenza vaccines), after which autism prevalence continued to rise. CDC, Thimerosal and Vaccines (https://www.cdc.gov/vaccine-safety/about/thimerosal.html): the page states thimerosal was taken out of childhood vaccines in 2001 and notes autism rates continued to increase afterward, the opposite of what would be expected if thimerosal caused autism. Schechter R, Grether JK. Continuing increases in autism reported to California’s developmental services system. Arch Gen Psychiatry 2008;65(1):19-24 (https://jamanetwork.com/journals/jamapsychiatry/fullarticle/482546): California DDS prevalence continued rising in cohorts born after thimerosal was excluded from nearly all childhood vaccines.
50. CDC, Impact of the US MMR Vaccination Program: Rubella Elimination (https://www.cdc.gov/rubella/vaccine-impact/index.html): during the last major US rubella epidemic, 1964-1965, an estimated 12.5 million people got rubella, 11,000 pregnant women lost their babies, 2,100 newborns died, and 20,000 babies were born with congenital rubella syndrome. Rubella was declared eliminated in the United States in 2004.
51. CDC, congenital cytomegalovirus: about 1 in 200 babies is born with congenital CMV, the most common infectious cause of birth defects in the United States (https://www.cdc.gov/cytomegalovirus/congenital-infection/index.html); CDC surveillance describes congenital CMV as the most common nongenetic cause of permanent hearing loss in US children (MMWR 2024;73(32):703-705; https://www.cdc.gov/mmwr/volumes/73/wr/mm7332a2.htm).
52. CDC Vital Signs: Missed Opportunities for Preventing Congenital Syphilis, United States, 2022. MMWR 2023;72(46) (https://www.cdc.gov/mmwr/volumes/72/wr/mm7246e1.htm): 3,761 congenital syphilis cases in 2022, including 231 stillbirths and 51 infant deaths, more than 10 times the 334 cases reported in 2012; lack of timely testing and adequate treatment during pregnancy contributed to 88% of cases, representing missed opportunities for prevention.
53. CDC, Zika virus and congenital Zika syndrome, including microcephaly (https://www.cdc.gov/zika/czs/index.html).
54. Iwashyna TJ, Ely EW, Smith DM, Langa KM. Long-term cognitive impairment and functional disability among survivors of severe sepsis. JAMA 2010;304(16):1787-1794 (https://jamanetwork.com/journals/jama/fullarticle/186769): severe sepsis was associated with roughly threefold higher odds of moderate to severe cognitive impairment (OR 3.34, 95% CI 1.53-7.25) and a high rate of persistent new functional limitations among survivors.
55. Kwong JC et al. Acute myocardial infarction after laboratory-confirmed influenza infection. N Engl J Med 2018;378(4):345-353 (https://www.nejm.org/doi/full/10.1056/NEJMoa1702090): incidence ratio 6.05 (95% CI 3.86-9.50) for acute MI during the first seven days after confirmed influenza, in a self-controlled case series.
56. World Health Organization, meningitis fact sheet (https://www.who.int/news-room/fact-sheets/detail/meningitis) and the Defeating Meningitis by 2030 roadmap (https://www.who.int/initiatives/defeating-meningitis-by-2030): roughly one in five survivors of bacterial meningitis is left with long-lasting after-effects, including hearing loss, seizures, limb weakness, difficulties with vision, memory, and communication, and limb amputations after associated sepsis.
57. CDC, chlamydia and pelvic inflammatory disease (https://www.cdc.gov/chlamydia/about/index.html): untreated chlamydia can ascend to PID, with fallopian tube scarring, tubal factor infertility, ectopic pregnancy, and chronic pelvic pain among the sequelae.
58. CDC, Chagas disease in the United States (https://www.cdc.gov/chagas/about/index.html): an estimated 280,000 people in the US are infected with Trypanosoma cruzi; 20-30% of chronic infections progress to serious cardiac or gastrointestinal disease.
59. Roughly half of pulmonary tuberculosis survivors have residual lung impairment after microbiological cure: pooled prevalence of abnormal lung function 46.7%, with persistent respiratory symptoms in 41.0%, across 32 studies and 6,225 participants in low- and middle-income countries (Maleche-Obimbo E et al. Magnitude and factors associated with post-tuberculosis lung disease in low- and middle-income countries: a systematic review and meta-analysis. PLOS Glob Public Health 2022;2(12):e0000805; https://journals.plos.org/globalpublichealth/article?id=10.1371/journal.pgph.0000805). A separate meta-analysis found abnormal spirometry in 59.1% of successfully treated pulmonary TB patients versus 5.4% of controls (Taylor J et al. Residual respiratory disability after successful treatment of pulmonary tuberculosis: a systematic review and meta-analysis. eClinicalMedicine 2023;59:101979; https://www.thelancet.com/journals/eclinm/article/PIIS2589-5370(23)00156-6/fulltext).
60. CDC, polio and post-polio syndrome (https://www.cdc.gov/polio/about/index.html): paralytic poliomyelitis at infection, with post-polio syndrome emerging about 15 to 40 years later; per CDC, PPS affects 25 to 40 of every 100 polio survivors.
61. Subacute sclerosing panencephalitis (SSPE), a fatal degenerative CNS disease that generally develops 7 to 10 years after measles infection: among persons infected during the 1989-1991 US resurgence, risk was an estimated 7-11 SSPE cases per 100,000 measles cases (CDC, Manual for the Surveillance of Vaccine-Preventable Diseases, chapter 7, measles; https://www.cdc.gov/surv-manual/php/table-of-contents/chapter-7-measles.html). Risk is substantially higher with infection in infancy and early childhood: in California (cases 1988-1991), 1 in 1,367 for children under 5 and 1 in 609 for infants under 12 months (Wendorf KA et al. Clin Infect Dis 2017;65(2):226-232; https://academic.oup.com/cid/article/65/2/226/3106340); in Germany, 1:1,700 to 1:3,300 for children infected under 5 (Schonberger K et al. PLoS One 2013;8:e68909; https://journals.plos.org/plosone/article?id=10.1371/journal.pone.0068909). CDC’s Pink Book measles chapter lists SSPE among fatal measles complications (https://www.cdc.gov/pinkbook/hcp/table-of-contents/chapter-13-measles.html).
62. CDC, West Nile virus and ArboNET surveillance (https://www.cdc.gov/west-nile-virus/index.html; data and maps: https://www.cdc.gov/west-nile-virus/data-maps/index.html): a substantial share of neuroinvasive West Nile survivors have persistent neurological deficits. In the Houston West Nile cohort, 86% (30 of 35) of encephalitis survivors had abnormal neurological examinations 1 to 3 years after infection, with gait impairment, hearing loss, abnormal reflexes, and muscle weakness largely persisting at 8 to 11 years (Weatherhead JE et al. Long-term neurological outcomes in West Nile virus-infected patients: an observational study. Am J Trop Med Hyg 2015;92(5):1006-1012; https://pubmed.ncbi.nlm.nih.gov/25802426/).
63. CDC, Antibiotic Resistance Threats in the United States, 2019 (https://www.cdc.gov/antimicrobial-resistance/data-research/threats/index.html): more than 2.8 million antimicrobial-resistant infections and more than 35,000 deaths annually in the United States; including Clostridioides difficile, the toll exceeds 3 million infections and 48,000 deaths. CDC tracks resistance through multiple surveillance systems, including the National Healthcare Safety Network (https://www.cdc.gov/antimicrobial-resistance/data-research/facts-stats/index.html).
The country has been pro-pharmaceutical intervention since at least the 1940s because there was no end of profit behind it. Successful therapies that require no doctor and require no prescription have been aggressively, undeservedly discredited by the same pharmaceutical-captured agencies you cite. On this topic, your position cannot be supported. We are currently living in a world where the pharmaceutical companies are colluding with government agencies to reduce life expectancy. The reduction in life expectancy is what they want. It provides an opportunity to further extract wealth by treating people with chronic disease and steal the wealth of the entire family transferring it upwards to parasites. Dead people also don't collect social security. Social security is a government liability. Ezekiel Emanuel supported the initiative by building the Complete Lives System. Anyone over 50 has supposedly had a complete life already.
The biological warfare you call vaccines are a key component of that effort.
Right now, a mother is on trial for murdering her babies in Colorado, though all evidence substantiates the vaccines killed them. Until there is an equal number of decades of evidence proving that vaccines are actually safe and effective instead of unlimited harm biologics combined with a liability shield, they need to be fought not advocated for. With these biologics, there can be no informed consent. The ingredients are tainted, hidden, uninspected, and no true placebo trials have ever been conducted.
If vaccines were safe and effective, then why does the liability shield need to exist? I expect no answer because the truth is self-evident.